


If you’ve seen this dot map of the United States, you know that not only is urban America culturally diverse, but parts of it are also still pretty segregated. But this is the case both within cities and between them. Ever wonder what the demographics of your city actually are, and how other cities measure up? How diverse is your city, compared to others of comparable size?
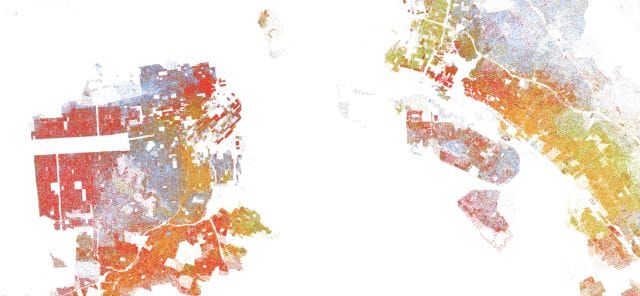
San Francisco Bay detail from dot map of the United States, color-coded by race (blue: White, green: Black, orange: Hispanic/Latino, red: Asian); Demographics Research Group UVA
The data in the charts below comes from the estimates released in the US Census Bureau’s 2013 American Community Survey.
Stuff White People Like: Portland
White people make up a larger percentage of the population of Portland, Oregon than they do in any other city in America of comparable size. Seattle, Washington, the other metropolitan gem of the Pacific Northwest, appears towards the top of this list, too.
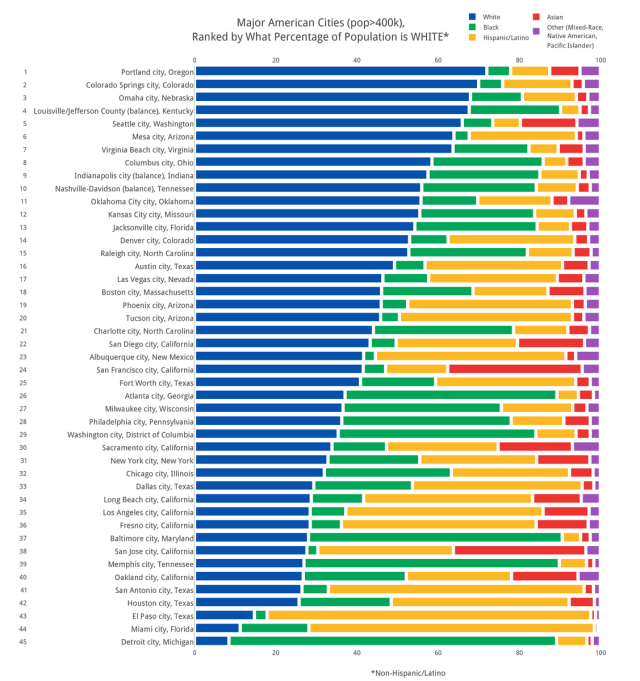
Priceonomics; data via American Community Survey 2013
Portland has already been outed as the whitest major city in America — at 72.2% white, it’s almost a full ten percentage points above the national rate of 62.6%. Nearly 10,000 people of color moved out of the city between 2000 and 2010. “The exodus from the central city causes me great concern; it is alarming,” Portland Mayor Sam Adams said.
The real story behind this chart, though, is that white people are relatively well-represented in almost every major city. The blue bars in this chart have a “fat-tail” when compared to the green bars in the next chart, or the yellow ones in the one after.
Detroit is 80.7% Black
Detroit, the city with the proportionally largest black population, is also getting a somewhat controversial reputation as the next-destination for hipsters (who are upwardly mobile, mostly white). Detroit is 80.7% black (non-Hispanic), compared to about 12.3% nationally. Also interesting is the fact that cities with large non-Hispanic black populations tend to have smaller Hispanic populations.
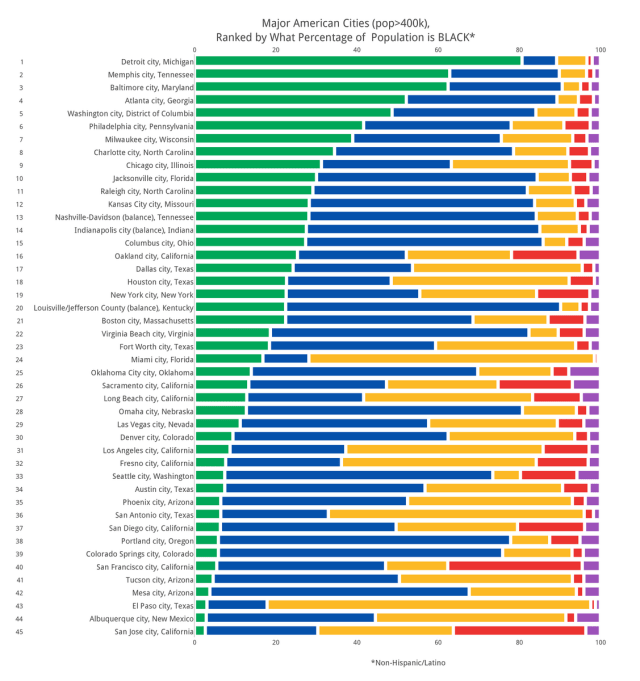
Priceonomics; data via American Community Survey 2013
Hispanic/Latinos are Best Represented in the Southwest
Last January, Pew Research predicted that in 2014 Hispanics/Latinos would become the largest racial/ethnic group in California, as they already had in New Mexico. And they also said Texas might soon follow. From the looks of this chart all of these trends are reflected in the states’ urban centers: Hispanics/Latinos are 17% of the national population, and 79.7% of El Paso, Texas.
Note: Hispanic/Latino is an ethnic designator, not a racial one. Many ethnic Hispanic/Latinos are racially caucasian — if you ignore the Hispanic/Latino label, El Paso is the “whitest” city in America.
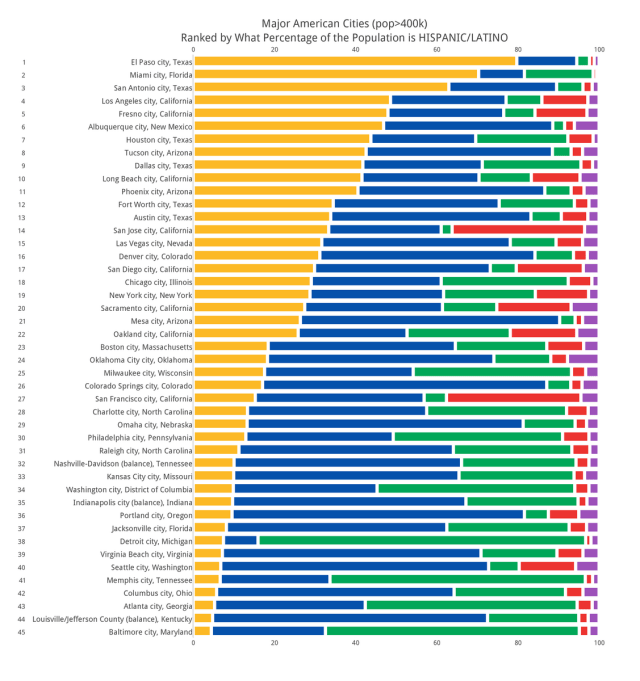
Priceonomics; data via American Community Survey 2013
Asians are Best Represented in California
While both Asian American and Hispanics/Latinos American populations are on the rise, unlike Hispanics/Latinos, the number of Asian American is growing more from immigration than from natural increase (births minus deaths). In 2013, Asian Americans became the largest immigrant group in Southern California. California has by far the largest (non-Hispanic) Asian population of any state.
San Francisco is the most Asian city in the United States, at 33.1% of the population being Asian. San Jose is a close second at 32.6%. Asians make up about 5.8% of the national population.
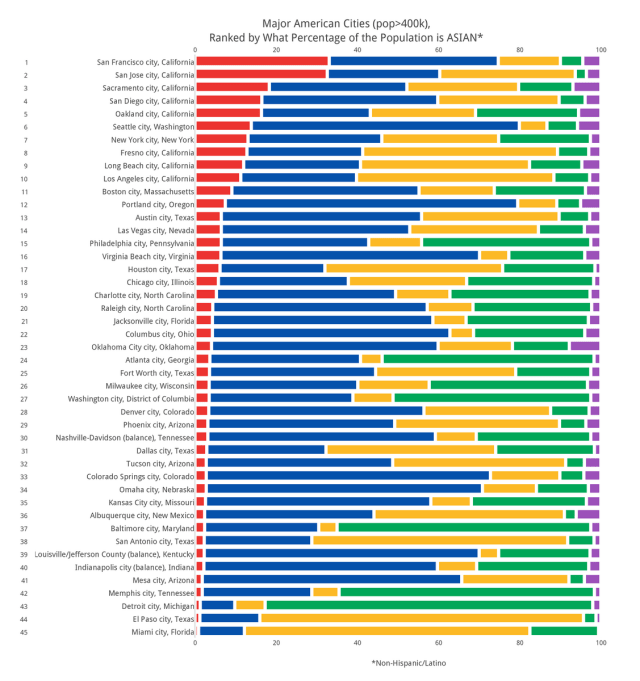
Priceonomics; data via American Community Survey 2013
This post was written by Rosie Cima; you can follow her on Twitter here. To get occasional notifications when we write blog posts, please sign up for our email list