


This post is adapted from the blog of Federal Charges, a Priceonomics Data Studio customer. Does your company have interesting data? Become a Priceonomics customer.
***
With the advent of body cameras and ubiquity of smartphones, videos of police shootings have brought the reality of the topic to the general public in a visceral way. Through social media and news reports, we often see these acts take place and make our own judgements on how justified the lethal use of force was.
But what does the data say about police shootings? How common is it for police to use lethal force via gunshot?
In this analysis, we worked with Priceonomics customer Federal Charges to analyze data from Fatal Encounters, a site that catalogues police killings from 2000 to 2018. We focus solely on shootings (which makes up 71% of all fatalities, death by vehicle makes up most of the balance) in the United States and compared it to the population numbers from the 2010 Census to calculate the death rate. For any city based analysis, we looked at the top 100 largest cities by population.
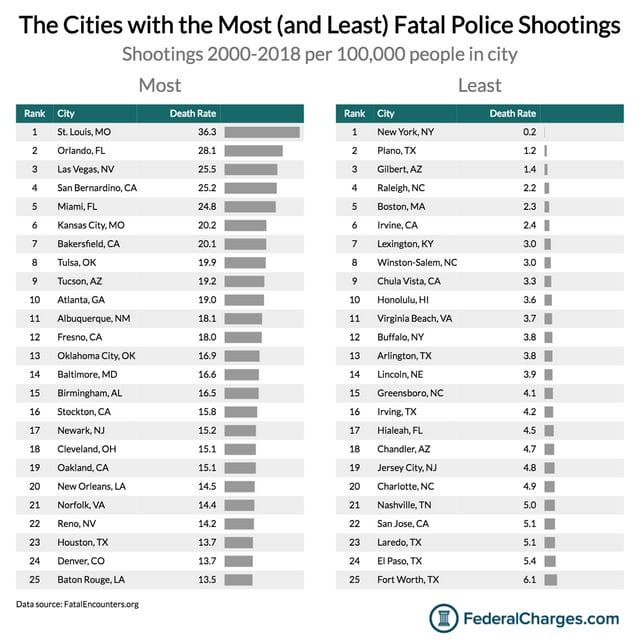
St. Louis is the city with the most per capita police shootings in America, followed by Orlando and Las Vegas. On the flip side, New York City has the fewest police shootings among large cities in America, where death by police gunshot is incredibly rare compared to other big cities. Demographic groups that are shot by the police far more often than their population size would predict are Men, Native Americans and Black Americans.
And while police shootings generally correlated with how violent and dangerous the city is, some places like Orlando, Las Vegas, Miami, and Bakersfield have a high level of police shootings for being relatively safe cities.
***
Fatal Encounters, a website created by journalist and professor D. Brian Burghart, has assembled a detailed database of deaths caused by encounters with police officers in America. The searchable and downloadable database has demographic information about the deceased as well as the location of the death.
We looked at all shooting deaths from 2000 to 2018 year to date and compared that to the population from the 2010 Census of the one hundred largest cities in America. Which cities have highest rate of fatal shootings by the police and which have the lowest?
Data source: FatalEnounters.or data via FederalCharges.com
By a substantial margin, St. Louis. Over this time period, there were 36.3 police shootings per 100,000 residents of the city. On the other hand, New York City has the fewest police shootings per capita with just 0.2. Put differently, a fatal shooting by a police officer is 180 times more likely in St. Louis than in New York City.
But this is not the complete story. Some places have a higher rate of crime, in which case you might expect higher levels of shootings by the police. Likewise for cities with lower levels of violent crime, you might expect fewer police shootings.
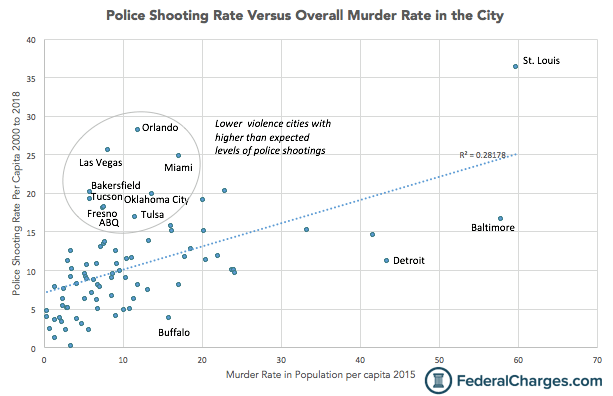
In the next chart, we plot the police shooting rate (Y axis) versus the overall murder rate of the city in 2015 according to the FBI. Cities far above the line have a higher rate of police shootings than you’d expect given the level of violent crime in the city, cities far below the line have lower number of police shootings than expected.
Data source: FatalEnounters.or data via FederalCharges.com
The first thing to call out on this chart is that cities that are more dangerous (have a high level of murders) also have the most police shootings. St. Louis may have the most police shootings in America, but it also has the highest murder rate in the population.
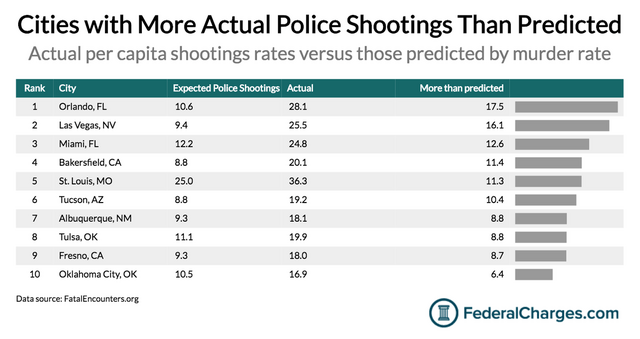
What this analysis also highlights is a cluster of large cities with relatively low levels of violence, but high levels of police shootings (these are the cities high above the line in the prior chart). Bakersfield California, for example, has the 6th highest rate of police shootings, but is a relatively safe city (low murder rate).
Data source: FatalEnounters.or data via FederalCharges.com
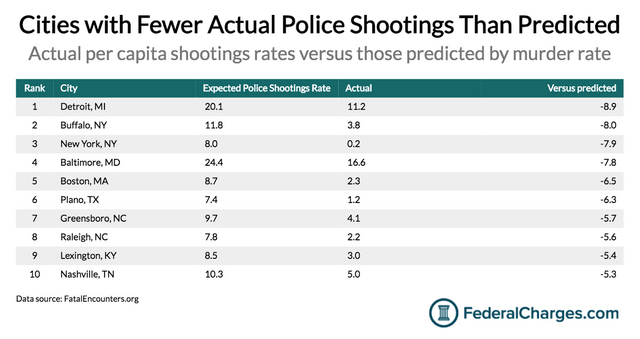
There are also violent cities (high murder rate), where the police shooting rate is lower than you’d expect (below the line). Buffalo (NY), for example, stands out for having relatively low levels of police shootings compared to the general murder rate.
Data source: FatalEnounters.or data via FederalCharges.com
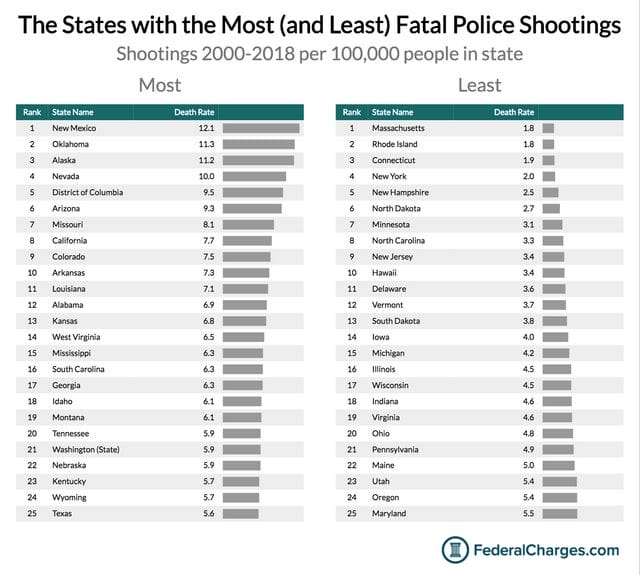
Next, which states have the highest (and lowest) rates of police shootings?
Data source: FatalEnounters.or data via FederalCharges.com
When taken together, the state of New Mexico has the most per capita shootings over the last eighteen years. New Mexico is followed closely by Oklahoma and Alaska as the top three states with the highest police shooting rates. In perhaps the clearest geographic pattern, states in New England take all of the top 5 spots with the fewest fatal police shootings.
***
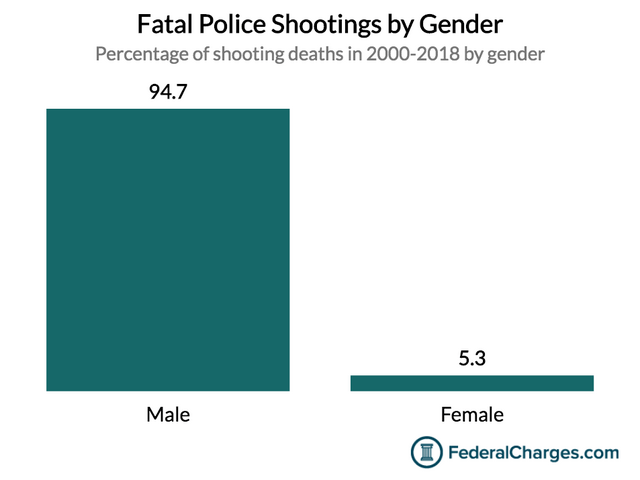
What does the Fatal Encounters data set say about who dies from police shootings? Though the population of the United States is roughly split 50/50 by gender, the population of those who are fatally shot by the police is not. Nearly 95% of people fatally shot by the police are men.
Data source: FatalEnounters.or data via FederalCharges.com
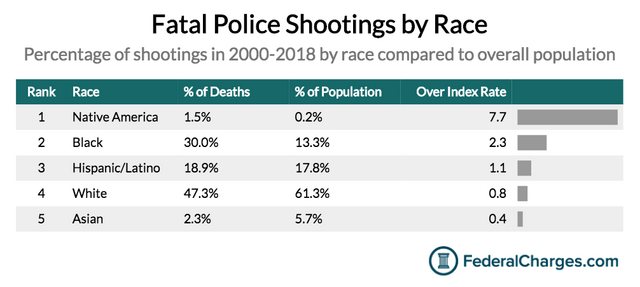
Which demographic groups die from police shootings at higher rates than expected given the the size of their populations? The chart below shows the percentage of the population by race, compared to the percentage of those who die from police shootings. The last column shows how much higher that race over indexes (>1) or under indexes (<1) for police shootings.
Data source: FatalEnounters.or data via FederalCharges.com
Native Americans make up just 0.2% of the population, but 1.5% of the deaths in the Fatal Encounters database. There are 7 times more police shootings of Native Americans than one would expect given their population levels. Black Americans die from police shootings at twice the rate of their population. Asians are the race that have the fewest police shootings compared to their population; Asians make up 5.7% of the population but only 2.3% of the police shootings.
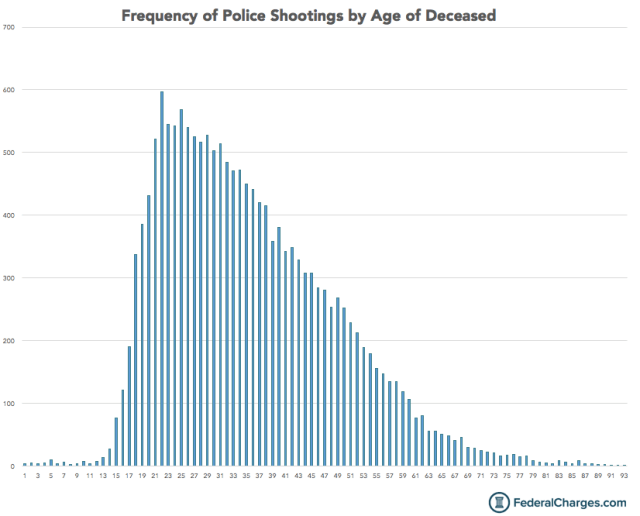
Finally, how old are those who die from police shootings? The chart below shows the frequency of death by age:
Data source: FatalEnounters.or data via FederalCharges.com
The most frequent age of death by police shooting is 22 years old. Death by police shooting is most common for people in their twenties, and then gradually declines linearly until elder age when it because extremely infrequent.
Conclusion
Police shootings are relatively uncommon, but their prevalence is not uniform; some places in America have a lot more shootings than others. Some of the most dangerous cities in America like St. Louis and Baltimore have a high rate of police shootings. But, some places that are relatively safe have an uncommonly high level of police shootings. Orlando, Las Vegas, Miami and Bakersfield are all cities where the police shooting rate is high relative to the murder rate in the city. Nevertheless, Detroit, Buffalo and New York City are all cities where fatal police shootings take place at a much lower rate than would be expected given the murder rate in the city.
Appendix: The Rate of Police Shootings in the Top 100 Largest Cities in America