


Attending college is among the best ways to move up the economic ladder. Bachelor’s degree holders earn more than two million dollars more over a lifetime than those without. Given the rising costs of education, many fear that good higher education is getting out of reach of the poor.
And when poor students do attend schools, they too often choose the schools for which students have the worst outcomes: Low graduation rates, high debt and low future earnings.
To battle these forces, the federal government implemented the College Scorecard initiative. This initiative is an attempt to highlight those schools which are low cost and financially remunerative, and to condemn those that are neither. While the primary feature of College Scorecard is a website at which students and parents can look up statistics about schools, another aspect of the initiative was the release of a huge, publicly available dataset, which includes a breakdown of outcomes by economic background.
We decided to use this data to see which schools are helping lower income students get into the middle class, and which are not. Where exactly does a low income student get the “biggest bang for their buck?” The answer seems to be that, if possible, poor students should attend the elite institutions that lead to high salaries and have generous financial aid programs. If these highly selective institutions are out of reach, as they are to most Americans, a technology-focused state school may be the best option.
Video of Obama announcing the College Scorecard release.
In 2013, when President Obama initially announced the College Scorecard initiative, it was intended to include a rating. The federal government would collect a huge amount of data on the costs and outcomes for students who attended different institutions, in order to rank schools by their performance on these metrics. The White House press office described it as “a new ratings system so students and families have the information to select schools that provide the best value.”
It had university presidents quaking in their boots. Schools offering high tuition and poor outcomes would be shamed into better practices, and low-cost schools with strong results would be lionized. In the end, under pressure from powerful universities and lobbyist groups, the Obama administration backed down from attempting such a rating.
Though institutions were not ranked, the government did create a website where this information could be accessed by the general public, along with an incredible dataset including a wealth of easy to access information on these schools. The dataset includes nearly 2,000 variables concerning the costs, graduation rates, and financial outcomes of over 8,000 institutions of higher learning from two years of federal data. NPR calls the release of this information a “data dump of epic proportions.”
The College Scoreboard dataset has its issues: Many community colleges are missing. Most of the statistics are only for students who accepted federal aid. It does not distinguish between the outcomes of people with different majors within a school, which may actually be a stronger predictor of outcomes than overall school choice. The accuracy of certain variables has been disputed.
Still, the dataset is a veritable treasure trove of information. Over 80% of students at 4-year institutions accepted federal aid, so it still is composed of a significant sample of the national college student body. It includes detailed information on the types of degrees offered (e.g. Associates, Bachelor), SAT and ACT scores, popularity of major, as well as the economic and racial makeup of the student body. Also, commensurate with College Scorecard’s goal of understanding which schools bring students up to the middle class, it includes information on the costs and outcomes for students broken down by economic background.
Throughout this article, we will refer to students from families with less than $30,000 in income, the bottom third of family income, as “low income,” $30,000-$75,000, the middle third, as “middle income,” and over $75,000, the top third, as “high income.”
How College Costs and Outcomes Are Different For Low Income Students
Differences in costs and outcomes by economic status are often stark. For example, while 86% of high income students at University of Michigan-Ann Arbor graduate within 6 years, this is only true of 66% of low income students. And even though the yearly average cost for low income students is $5,500, compared to about $20,000 for students from high income families, these students are still 5% less likely to begin repaying their federal debt within 3 years.
The table below shows the average costs and outcomes for high income and low income students for the average school. This analysis includes schools with over 500 students that are primarily undergraduate degree-granting institutions. Schools are omitted if data is not available for all income levels. For definitions of each variable, see our methodology page.
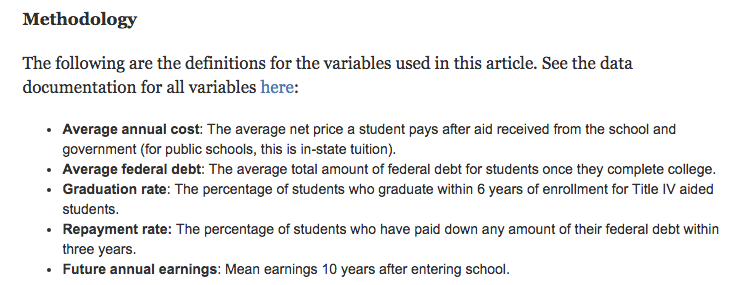
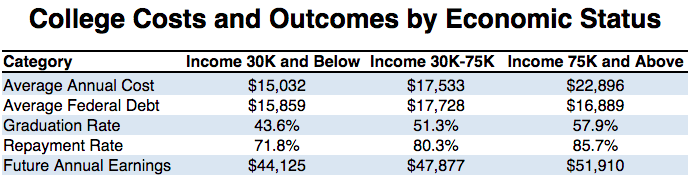
This data shows that, for the average school, though low income students pay less and have a bit less debt, their graduation and repayment rates are significantly lower, and their post-graduation incomes are 15% lower than high income students.
Yet this doesn’t tell the whole story. Certain schools have particularly dramatic differences for students of different backgrounds, while others have much closer outcomes.
For example, at the University of Oregon, the graduation rate for low income students is 63%, and 65% for high income students. That difference (2%) is much smaller than the national average (14%). On the other side, we find a massive difference in outcomes for students at California State University-Fullerton. California State-Fullerton has a 64% graduation rate for high income students, and a 40% graduation rate for low income students, a difference (24%) that is 10% greater than the national average.
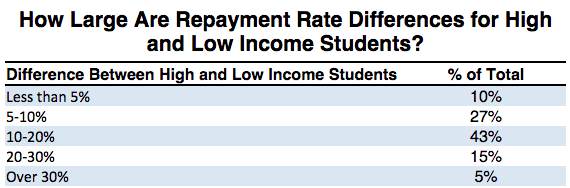
These large differences between schools exists for all of the variables we analyzed. The table below shows how many schools have large differences between low and high income students.
The schools at which high income and low income performance varies the least tend to be among the most highly rated schools. For example, at Yale University, ranked third among national universities in US News and World Report, the repayment and graduation rates for students from different backgrounds are indistinguishable (though students from high income backgrounds still tend make to a great deal more money after college). On top of that, it is among the most affordable schools for low income students, costing only $7,600 annually, which is nearly $30,000 less than what a student from a high income family would pay.
In general, low income students seem to benefit from attending highly selective schools even more than others. In the chart below, each school is represented by three points: a blue point for the graduation rate of low income students; a orange point for middle income students; and a green point for high income ones. The chart demonstrates that for the very selective schools, outcomes are not that different, but as we move further to the right on the chart to less selective schools, the outcomes get further apart.

Dan Kopf, Priceonomics; Data: College Scorecard
So the best solution for low income students is to go to exceptionally selective schools! But of course, that is not realistic. The thing about exceptionally selective schools is that they’re exceptionally difficult to get into. Yale, for instance, only accepts 7% of their applicants.
On top of the fact that they are selective, these schools tend to accept low-income students at a low rate. The following chart depicts the relationship between admissions rates and the proportion of students who received pell grants. Pell grants are financial assistance given to low income students, and do not require repayment.
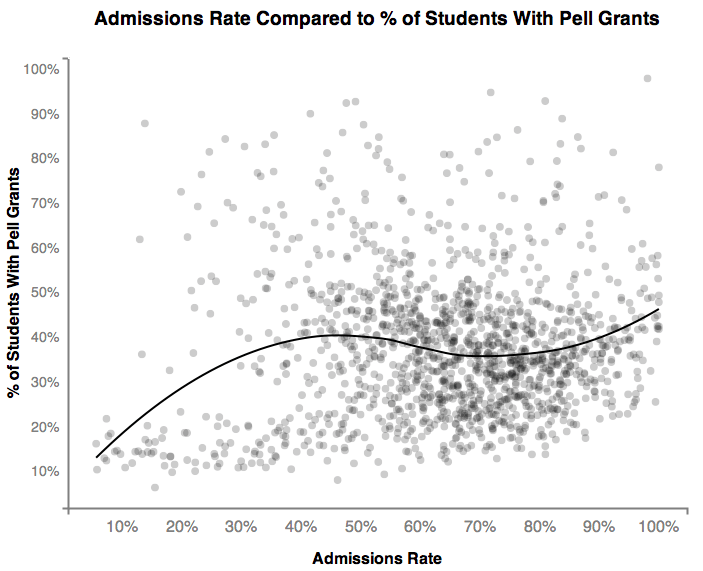
Dan Kopf, Priceonomics; Data: College Scorecard
So which schools are both accessible to low income students and lead to strong outcomes for them?
Coming up with a list of such schools is complicated and controversial. The difficult nature of assessing which costs and outcomes are most important is one of the reasons the federal government decided not to create their planned rankings. Instead, they released a variety of lists, such as an unranked list of schools with “high graduation rates and low costs”, displayed below.
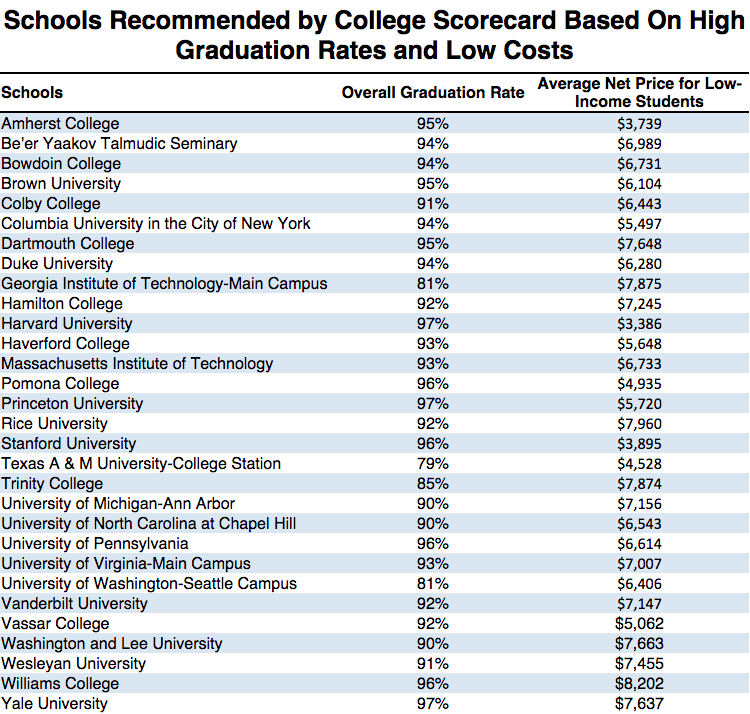
Though there are a few surprises on this list, it is mostly littered with Ivy League schools, as well as other exceptionally selective schools like Duke University, Stanford University and Williams College. Thanks for the advice, government!
We decided to take a stab at creating a list of schools that are relatively accessible to low income students given the strength of their outcomes. Since coming up with such a list is an inexact science, we decided to rank schools as simply as we could. We used the following formula.

We could certainly have weighted certain factors more or less, but the resulting list seems a good starting point. Not all of these variables are available for every university. Schools missing data were removed from contention.
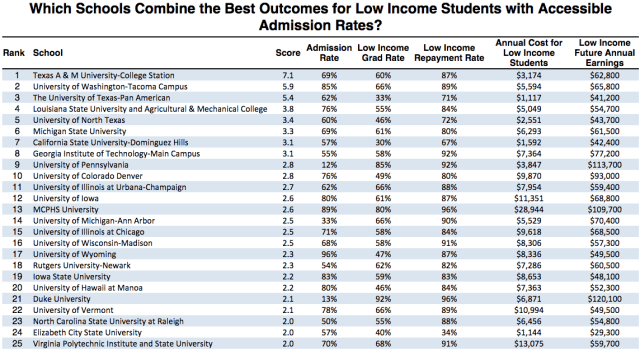
Notable for its high admission rate of 69% and low tuition of $3,174, Texas A&M tops the list. It is among the many public universities with a technology focus that makes this list. Other, similarly focused schools on the list include Louisiana State and Michigan State.
Public schools dominate the list. Only the University of Pennsylvania, MCPHS (Massachusetts College of Pharmacy and Health Sciences) and Duke University are private. These schools make the list, in large part, as a result of low income students’ high expected income after attending, and because they are not quite as selective as the very top schools.
The dominance of public institutions on our list may be owing to the fact that the annual cost number is only for in-state students. Many of these schools would not rank nearly as highly for those out of state. The following lists looks only at private schools, for which in-state tuition is not a factor.
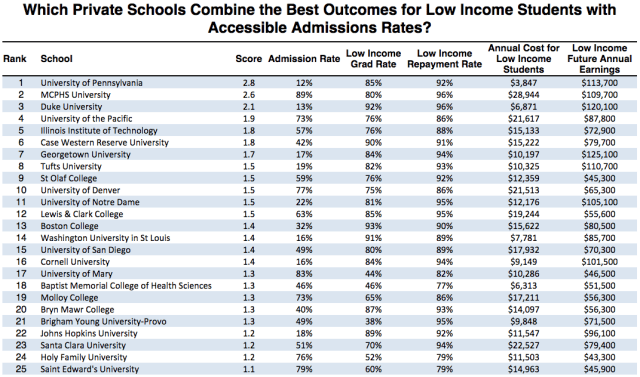
Many of the schools that make this list are just outside the very top universities, but still prestigious. Though none of the top five schools in the country make this list, due to their extreme selectivity, six of the schools in the list are in the top 25 as ranked by US News and World Report.
Schools like the University of Denver, Lewis and Clark, and Molloy College make the list on the strength of their high acceptance rate combined with respectable outcomes. These are schools that, though expensive, are relatively easy to get into, and then pay back your debt afterwards.
What about the very worst schools by this metric? For this list, we exclude admissions rates, as for these poor performing schools, admitting students actually might hurt them more than it helps. For this list, we only look at schools with over 5,000 students.
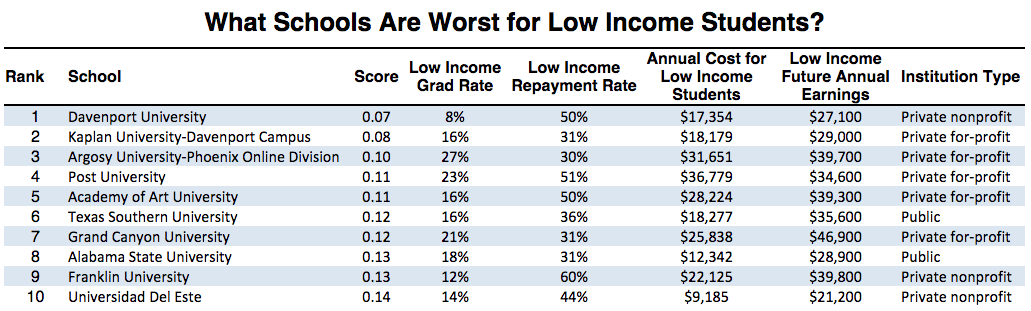
Out of these 10 schools, 5 are private for-profit institutions. Some for-profit institutions have been accused of being predatory lenders, taking huge amounts of federal aid and loans and providing little of benefit. These schools are expensive and lead to high amounts of debt and low future earnings. Kaplan University, second on this list, recently settled a suit with the Justice Department in which it was accused of using unqualified instructors.
***
The statistics released by the College Scorecard focus on financial outcomes, and, of course, attending college can be about much more than increasing your paycheck. Some at universities, understandably, complain that these types of rankings obscure the value of non-technical learning. Schools at which students take more liberal arts classes will typically look worse, as STEM (science, technology, engineering and math) students generally make more money and have an easier time dealing with their debt.
But if we grant that a primary goal of college attendance for low income students is socioeconomic mobility, we can learn a great deal from this data about which schools are effective at helping students achieve that goal. Our analysis shows that, in general, the very best schools are also the best ones for low income students to attend if they can manage to get in. There are also a variety of public institutions that provide great bang for your buck, particularly when compared with the potentially devastating debt and poor financial outcomes associated with the many for-profit institutions near the bottom of our list.
And as a general rule of thumb, if you’re a student coming from a lower income family, be very wary of any school trying to charge you an extravagant amount of money for school. The best schools make college affordable, and the worst schools are simply predators.
For our next post, we delve into the economics of professional pumpkin carving. To get notified when we post it → join our email list.
![]()
This post was written by Dan Kopf; follow him on Twitter here.