


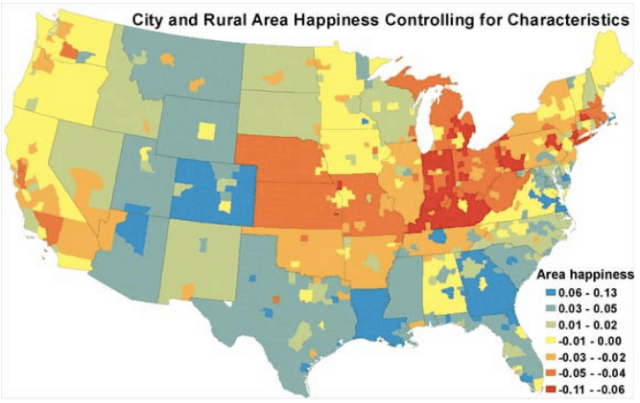
Relative happiness of residents of different metropolitan areas. Source: Unhappy Cities, NBER
Where are the happiest places in America?
Do the beach and sun make Los Angeles residents some of America’s happiest? Or are their lives defined by gritting their teeth through traffic? Are Seattleites depressed by constant cloudy weather? Or well compensated with good coffee and beautiful wilderness? And are rural dwellers missing out on all that cities have to offer? Or living a blissful existence that rat race New Yorkers would envy?
People often tout the greatness of their hometown like fans brag about their favored sports team, but the above map offers an objective take. The map comes from a working paper titled “Unhappy Cities,” written by researchers Edward L. Glaeser, Joshua D. Gottlieb, and Oren Ziv for the National Bureau of Economic Research. Despite the title, the paper does not suggest that we should all move to the countryside.
Glaeser, Gottlieb and Ziv draw on several data sets that measure happiness, chiefly a national survey from the Centers for Disease Control and Prevention that simply asks, “In general, how satisfied are you with your life?” While recognizing that this is not necessarily the same as happiness, the authors use this as an estimate of Americans’ happiness or “subjective well-being.” Consistently, around 45% of Americans have responded that they are “very satisfied” with their life.
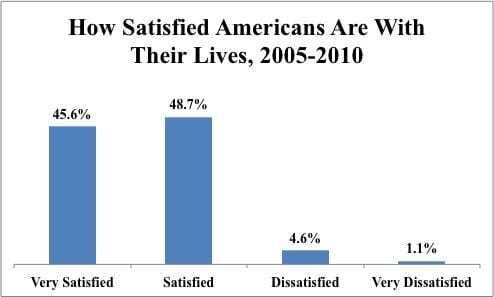
Data from the CDC’s Behavioral Risk Factor Surveillance System via Unhappy Cities, NBER
As we see in the map, some parts of the country are, on average, happier than others. The variation is modest but not significant. Researchers who study happiness have found that high school graduates report higher life satisfaction levels than dropouts and that, up to a point, higher incomes translate to better well-being. The authors explain that the difference in happiness levels between a city or town that is one standard deviation happier than another area is about half as large as the increased well-being reported by high school graduates. Similarly, it’s half as powerful as the effect on happiness of earning $50,000 to $75,000 rather than $35,000 to $50,000.
It could be that fun cities attract happy people while misers flock to dull, dreary cities. But by looking at surveys of Americans on the move, Glaeser and co. dismiss this idea. Newcomers appear to very quickly conform to the happiness level of their new home. So while other factors matter more — like income, education level, age, and marital status — where you live does have a very real impact on your well-being.
But while the map can offer some guidance on which areas tend to be happier, the paper reveals few guiding principles. New York City is unhappier than average, but on the whole, urban areas in America are not less happy than rural or suburban ones. Among cities, the small city of Charlottesville, Virginia, tops the rankings, and Washington D.C. and Atlanta both rank as happier than average. The impact of weather is also small (and for the record, Seattle ranks right in the middle of the life satisfaction rankings). As for the tech world, San Francisco, which feels increasingly annexed by Silicon Valley, ranks slightly below the national average for urban areas, but San Jose is right in the middle.
One trend, however, is very clear. Declining cities like Detroit, Michigan, and urban areas in the Midwest are particularly unhappy. And the TV show The Office had it right: Scranton, Pennsylvania, ranks as one of the unhappiest areas in the country, as the 367th happiest metropolitan area out of around 380.
The Happiness Equilibrium
Many Americans dream about improving their life by moving to a dream city or settling down in a peaceful, coastal town. But on a macro level, a popular idea in urban economics called “spatial equilibrium” posits that it should not be possible to improve your well-being by moving. The idea is that people vote with their feet and move to places with better prospects, amenities, or so on until an equilibrium is reached where wages, prices, and other factors that contribute to well-being all even out across the country. In equilibrium, no place is really better than where you are now.
The variation in happiness levels around the country seems to contradict this idea, and this author finds himself skeptical. Do impoverished residents of Appalachia really stay put because the region offers the same odds of finding happiness? Doesn’t the presence of family and friends often make where you happen to live the best place for your happiness? And doesn’t simple inertia make spatial equilibrium seem far-fetched?
Glaeser and co., however, believe that their findings can fit this reigning paradigm.
One striking result is that when the researchers controlled for people’s incomes, wealthy, urban areas like New York City stood out as the most unhappy regions along with Midwestern cities. Since income levels, on a macro level, correspond strongly with subjective well-being (as several social scientists put it, “If money doesn’t make you happy, then you probably aren’t spending it right”), this doesn’t necessarily indicate that New York is particularly unhappy. But the fact that New York stands out after controlling for income does suggest that New Yorkers are sacrificing well-being for higher wages.
The authors don’t necessarily think this means New Yorkers are less well off. While economists use the comfortably vague word “utility,” philosophers have endlessly debated whether one should pursue pleasure, enlightenment, higher pursuits, or so on. In cities with higher wages, people can use those wages to live better, but they also have less leisure time. That could make them less happy, but people may value the prestige and accomplishments of higher remunerated careers. In sum: wealthy urban residents may trade one good (happiness) for another (achievement, etc).
This can also explain the unhappiness in declining, Midwestern cities. While it may seem intuitive that lower levels of happiness are a response to the poor economy and social ills of cities like Detroit, the authors’ look at historical data suggests that those cities were just as unhappy when they were prosperous, economic engines. How could that be? When the cities were wealthy cities of industry, people put up with pollution and all the conditions that drove the wealthy to the suburbs in exchange for higher salaries and good careers. Now that the cities are in decline, people are compensated for the poor conditions with cheap housing prices — something that today draws newcomers seeking cheap homes and office space.
There may be a lesson in this geographic patchwork of color — and it’s not just that Jim and Pam had the right idea when they left Scranton, PA for Texas in the final episode of The Office. The researchers see each different colored region as reflecting a trade-off. Maybe that interpretation is driven by a flawed theory; maybe it’s accurate. On a personal level, our choices are not defined by geography — there are people hustling in sleepy hamlets and living leisurely in Manhattan. But we all make trade-offs, acting on (at times) mutually exclusive priorities and goals. It would be best to make them consciously.
This post was written by Alex Mayyasi. Follow him on Twitter here or Google Plus. To get occasional notifications when we write blog posts, sign up for our email list.