


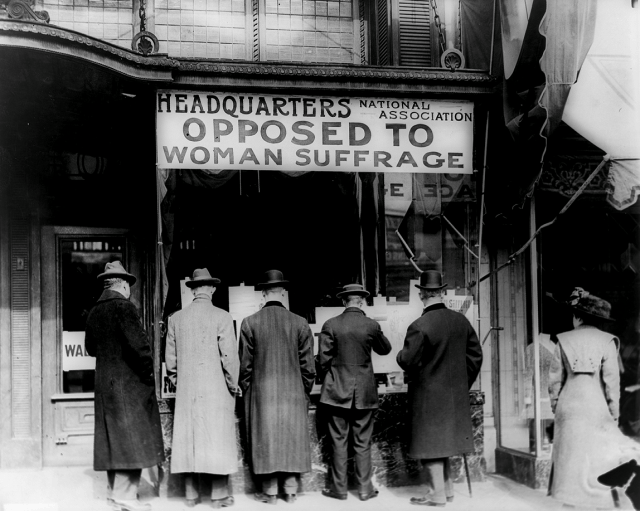
Credit: Library of Congress
If women and African-Americans voted today at the same rates that they voted in the 1960s, Donald Trump would likely become our next president.
Luckily for the supporters of Hillary Clinton, they do not.
American voting patterns have changed significantly over the country’s nearly 240-year history. The long-term shifts are characterized by changes in law that granted or protected the voting rights of women and minorities.
More recent history is typified by specific groups asserting their voting rights to greater degrees. Women, African-Americans, and the highly educated now vote at relatively higher rates than at any time in modern history, while voting among the less educated and men is declining.
If only White men of property could vote, as was true in the first presidential elections, Hillary Clinton would not stand a chance. Even looking back just a few decades, the turnout deck would be stacked against her. But almost all of the changes in the demographics of votes in presidential elections favor Clinton’s chances of becoming our first woman president.
***
In 1789, George Washington ran for president unopposed and received virtually 100% of the vote. Turnout was low.
At the time, White men of property were the only Americans with the right to vote, and only an estimated 11.6% of them showed up to the polls for Washington’s unanimous victory. For his re-election in 1792, turnout was a paltry 6.2%. Turnout would never be so low again.

Barring a notable dip around 1820 – which coincided with the collapse of the Federalist Party and the belief that the presidential election was a foregone conclusion – turnout among eligible voters consistently rose in the 19th Century.
Turnout reached its highest level at the end of the 19th Century. While scholars are uncertain about why men – and it was still only men – were so likely to vote at that time, most point to unusually close elections and the centrality of party politics to social life.
The following chart shows that though the first half of the 20th Century saw a decline in turnout, it also saw a great increase in the percentage of the total population that actually voted. (We do not have good historical estimates of the voting age population, so this chart shows the proportion of the entire population).

Data: Fairvote.org
In this chart, we can see two important jumps in the proportion of the population that voted.
First there is a small jump from 1864 (12%) to 1876 (18%). This increase is primarily due to the passing of the 14th and 15th Amendments, which acknowledged and protected the right to vote of black men. By that time, all White men, even those that didn’t own property, were already allowed to vote in all states.
Following Reconstruction, the period after the Civil War when the Southern states were occupied by the federal government, this right was constantly under attack. To some extent, the Black franchise is still threatened by strict voter-identification laws that would result in a decrease of the Black vote.
The second larger jump occurs from 1912 (16%) to 1940 (38%). This increase is a result of women winning the right to vote, which was cemented by the 19th Amendment – a number of states had already extended the right to vote to women prior to the Amendment.
Initially, women did not vote at the same rates as men.
Although official statistics on turnout by gender were not collected until 1964, a study of eligible voters in Chicago for the 1920 election shows that voting rates for men (76%) were dramatically higher than for women (45%). The primary reasons women reported not voting were “general indifference,” a “disbelief in woman’s voting,” and “Neglect.”
But over the next 100 years, the voting gender gap flipped.
In 1964, women still voted at lower rates, but by 1980, the turnout of women had surpassed men. And the gap between men and women continued to increase. Given Hillary Clinton’s double-digit advantage among women and Trump’s double-digit advantage among men, this is very good news for the Democratic nominee.

Data: United States Census
If women in 2016 vote at a higher rate than men—as they did in 2008 and 2012—that will give Clinton roughly 0.25% more votes than she’d receive if men and women voted at equal rates. In states that have historically had close races, like Florida and Ohio, this could swing the election.
A gender gap in turnout rates similar to 2008 and 2012 would gives Clinton about 0.25% more of the vote than if turnout did not differ by gender. In states that have historically had very close races, like Florida and Ohio, this could make the difference.
A similar trend has taken place with black voters. During the past two presidential elections, Black turnout surpassed that of white voters, in percentage terms, for the first time in American history.
In 1964, Whites voted at a rate 12 points higher than Blacks (70.7% to 58.5%). In the 2008 and 2012 elections, Black turnout was about 1% and 4% higher than Whites, respectively.
The opportunity to elect the nation’s first African-American president helps explain this trend, but Obama is only part of the explanation. The gap between Black and White voting rates has been narrowing since 1992.
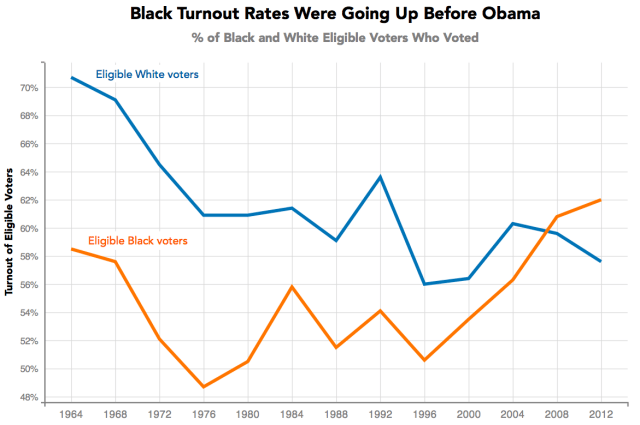
Data: United States Census Note: Researchers have found that demographic turnout rates reported by the Census overestimate turnout.
The recent rise of Black voting rates is mostly due to gains in the South. Black turnout rates outside of the South have always been closer to Whites, but following the Civil Rights Act of 1964 – which made discriminatory voter registration requirements illegal – the turnout rates of Black and White voters in the South began to converge. That convergence has been a slow process, and it finally culminated in Black turnout rates that are now equal inside and outside of the South.
The question of whether Hillary Clinton can maintain these levels of Black turnout is a key to the 2016 election. One Fox News poll showed that only 4% of Black Americans intend to vote for Trump. A simulation model from NPR suggests that a Black turnout rate 8% lower than 2012, which is similar to what it was in 2000, could swing the election Trump’s way.
Of course, America is no longer so Black and White. The proportion of the U.S. population that is Asian or Hispanic has risen significantly over the past 50 years. But though their proportion of the population has increased, their share of the voting population has trailed behind. Turnout rates among Asians and Hispanics are quite low.

Data: United States Census
Less than 50% of eligible Hispanic and Asian citizens voted in 2012. Their voting rates are more than 16% points lower than those of Blacks and non-Hispanic Whites, and recent trends do not suggest that this disparity is likely to change.
One poll of non-voters showed that Hispanics and Asians were unusually likely to answer that they did not vote because they were too busy or forgot. For Hispanics, another reason for the low turnout rate may be that eligible Hispanic-American voters skew young, and, as we will see, young voters are significantly less likely to vote. For Asians, many observers point out that it is difficult to target get out the vote effort because of this group’s heterogeneity in terms of language and culture.
Some polls show Clinton leading the wall-building Trump by nearly fifty percentage points among Hispanics. Likewise, Asians overwhelmingly supported Obama in 2012. Hillary supporters would love to see these groups head to the polls in greater numbers, and some pundits are predicting that Trump’s anti-immigrant sentiments could lead to record turnout among these groups.
You might have noticed in the previous chart that we used turnout rates for eligible “citizens” rather than just the adult population. Since 1992, the Census has calculated voting rates among citizens, rather than just the voting age population. Given the relatively large numbers of Asians and Hispanics who are non-citizen immigrants, it would be misleading to look at turnout among those of the age to vote.
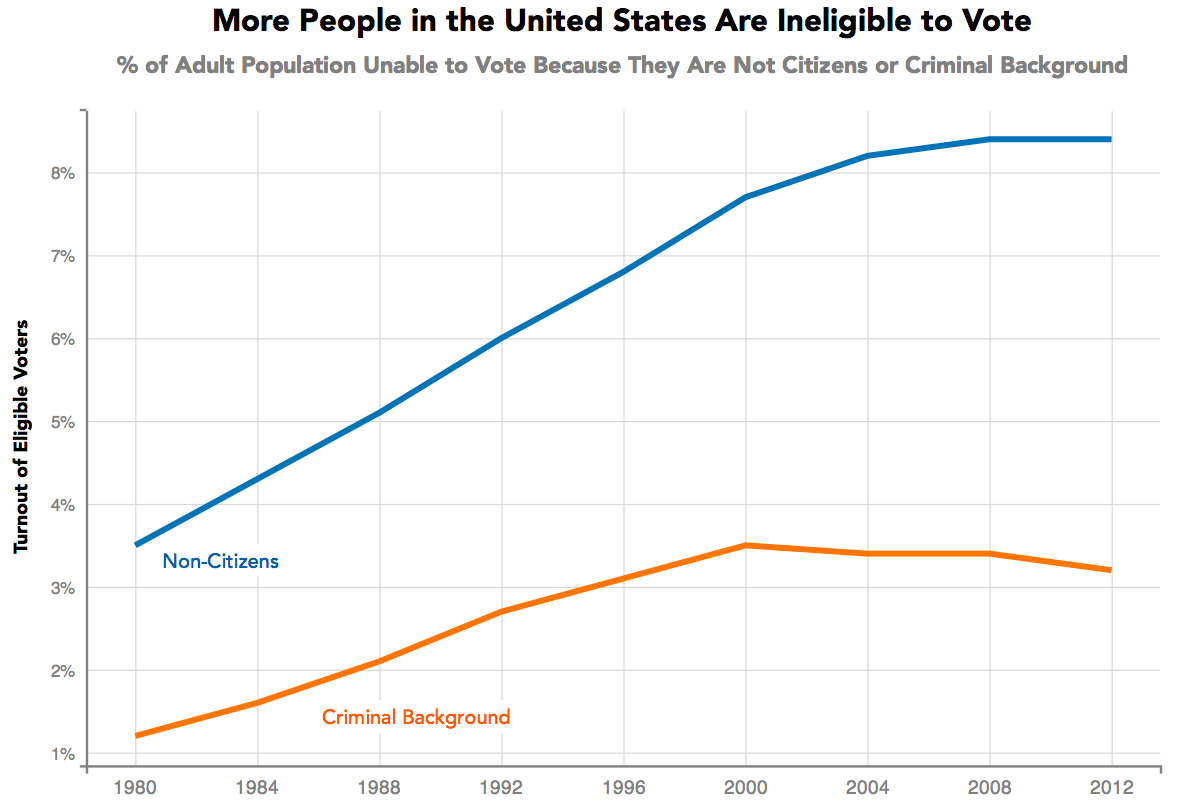
Another reason looking at turnout by race/ethnicity for the voting age population may be misleading is the relationship of voting rights to the criminal justice system. State laws vary, but the vast majority of people in the United States who are in prison, on parole, or on probation, cannot vote. And in some states you must petition the courts to vote if you have ever had a felony conviction. Because people who are Black are much more likely to be incarcerated, these laws disproportionately impact African Americans.
The following chart displays the increasing number of adults in the United States since 1980 that cannot vote either because they are not a citizen or because of their relationship to the criminal justice system.
***
Though gender and race/ethnicity are important indicators of turn out, they pale in comparison to the effect of age and education level.
In 2012, Americans with post-graduate degrees were 50 percentage points more likely to vote than those who had not finished high school. And people over 60 were over 30 points more likely to vote than those ages 18-29.
The chart below shows that since 1988, when the Census first began collecting these turnout figures, these disparities have widened.

Data: United States Census
Though overall turnout increased from 1988 to 2012, turnout among eligible voters without a high school degree actually declined by more than three percentage points. At the same time, voting rates among college graduates increased. This is not simply a reflection of the ivory tower’s affection for Obama. The same trends appear in 2004.
In terms of age, Americans are more inclined to vote as they get older. But in the last several elections, including the pre-Obama election of 2004, youth turnout rates have risen. In 2012, more than 40% of 18- to 29-year-olds turned out to vote, compared to just 35.7% in 1988.
Yet the under 30 share of the electorate actually decreased during that period from 18.1% to 15.4%, largely because voting rates among seniors grew even more. That segment of the population, which includes the baby boomers, is growing larger.
Trump supporters will be hoping that the surge in voters over age sixty continues, as this is the group with which he seems to have the most significant advantage.
***
One influential determinant of voter turnout is often overlooked: which state a voter lives in. In 2012, there was a larger gap between the state with highest turnout, Minnesota (76.0%), and the state with the lowest, Hawaii (44.2%), than there was between the young and the old.
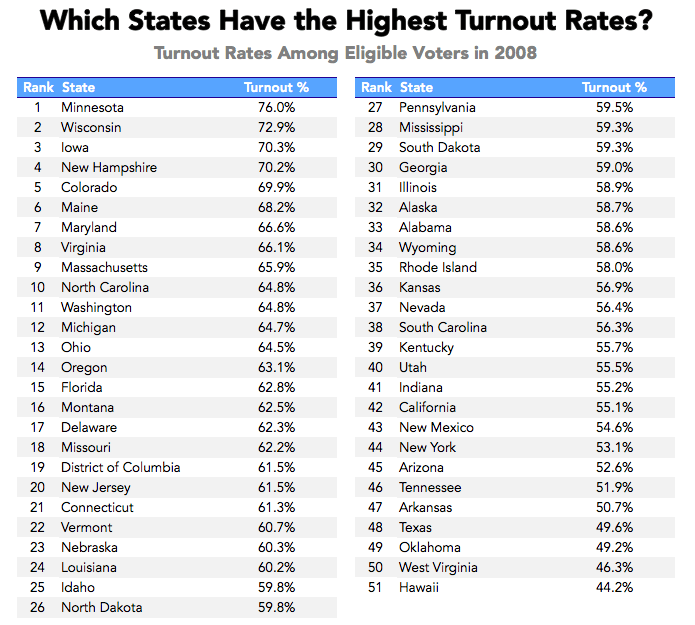
This contrast is partly determined by which states have demographics that are conducive to high turnout rates. States like West Virginia and Arkansas, where education levels are unusually low, tend to have low turnout.
Turnout by state is also related to state policy on voter registration. The states with the highest turnout rates, like Minnesota, Wisconsin and Iowa, are more likely to allow early-voting, same-day registration, and to not require an identification card.
Turnout rates are not nearly as dependent on whether a state is a “battleground” as one might suspect. Reliably Democratic states like Minnesota, Maine, and Massachusetts have high turnout, and battleground states like Nevada and Pennsylvania rank in the bottom half of states in terms of turnout. State turnout rates show similar disparities in non-presidential years, indicating that many other factors draw voters to the poll besides a competitive race.
Turnout in some states has shifted substantially in just the last several decades, particularly for the East Coast states just below the Mason-Dixon line. The following table shows this change from 1980 to 2012.

All five of the states that have seen the largest surges in voter turnout are Southern states on the Atlantic coast. Turnout rose by more than 14 percentage points in North Carolina, Virginia, Georgia, South Carolina and Maryland. And all of these states are outdone by the District of Columbia, which is ensconced between Maryland and Virginia and saw a 24 point increase.
What all of these states and D.C. have in common are large Black populations. This is great news for Hillary Clinton. Higher Black voter turnout in Virginia almost certainly increases her chances of winning the state than the selection of Tim Kaine as her running mate.
***
Over the next four months, the Trump and Clinton campaigns will spend millions of dollars and mobilize thousands of volunteers to influence voters in battleground states. But the contours of this intense political arena has been defined by demographic and legal forces over 100 years in the making.
Almost all of the changes in who votes in presidential elections – more women, Blacks, and college graduates vote now than ever before – favor Hillary Clinton. The one major countervailing force is the increasing share of older voters, which favors Trump.
Still, the world of the 1960s and 1970s, where White men were dramatically more likely to vote, is gone. As a result, we are substantially less likely to see a Trump presidency. As long as people turn out to vote, that is.
Our next article investigates why gas prices is California are so damn high. To get notified when we post it → join our email list.
![]()
Note: If you’re a company that wants to work with Priceonomics to turn your data into great stories, learn more about the Priceonomics Data Studio.