


In a previous blog post, we pointed out that it’s expensive to live in San Francisco. A one bedroom apartment in the city rents for $2,800. In a follow-up, we again told people what they already knew – living anywhere in the Bay Area is expensive. Within 60 miles of San Francisco, the median price of a one-bedroom is $2,200. That’s expensive, but at least it’s possible to save money by living outside San Francisco.
Oakland caught our eye. Located just 12 miles and a quick train-ride away from San Francisco, the median price of a one-bedroom is $1,400. That’s half price of living San Francisco! Sure, prices have increased 33% percent over the last two years (the 6th fastest rate of growth in the Bay Area), but the price is still relatively low for the area.

Source: Priceonomics rental data
We decided to give Oakland a closer look. How much does it cost to live in the city? Why is it inexpensive compared to San Francisco? How has the city changed over time?
Renting in Oakland
Priceonomics is now tracking rent prices in every city in America, including Oakland. (If you’d like to learn more about the methodology or become an early customer of the data, get in touch here).
While the median rent in Oakland for a one bedroom is $1,400, some areas cost quite a bit less and others quite a bit more.
 Source: Priceonomics rental data
Between different zip codes, the price a one bedroom can vary from $825 a month (in East Oakland) to almost $1900 (in the area that includes Jack London Square, a desirable downtown-waterfront location).
Let’s group the data by region instead to see what areas are more or less expensive.
 Source: Priceonomics rental data
Analyzing the apartments by region tells a similar story. Downtown Oakland is the most expensive place to rent a one bedroom. East Oakland is about half the price.
Even controlling for the size of the apartment, the price per square foot of an apartment in Downtown Oakland is 78% more expensive than East Oakland. But that’s still substantially less expensive than apartments in San Francisco or Berkeley.

Source: Priceonomics rental data
Finally, let’s look at how fast rent has increased by neighborhood over the last two years.

Source: Priceonomics rental data
Economic Trends in Oakland
Changes in the unemployment rate in Oakland roughly track those in other cities of the Bay Area. However, the unemployment rate in Oakland is twice that of San Francisco.

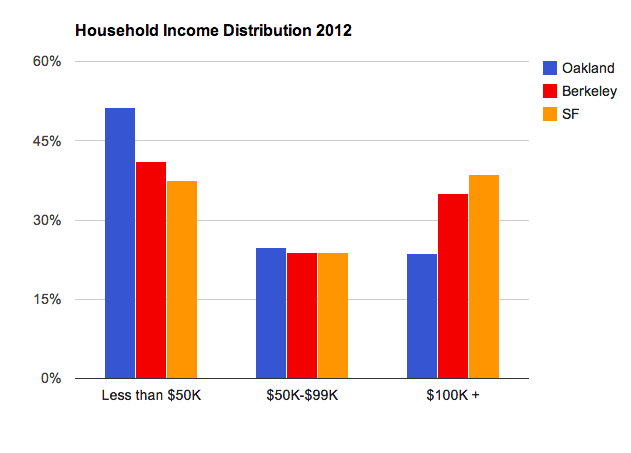
The household median income in Oakland is $48K. That’s 34% lower than in San Francisco ($73K) and 27% lower than in Berkeley ($66K).

The percentage of the population in the middle income bucket in each city is roughly similar. However, Oakland has more households earning less than $50K per year and fewer earning $100K or more.
From 1950-1980, Oakland (along with San Francisco) experienced 30 years of population decline. (Berkeley, however, stands out for having a very groovy growth rate in the 1960s.) From 1980 to 2000, the city’s growth rate rebounded. The decade from 2000 to 2010 appears to be a bad one for the city. More people left than arrived even as neighboring cities continued to grow. Since 2010, however, the city has been growing as quickly as San Francisco and Berkeley.

Oakland’s demographics have been equally dynamic. Post World War II, the city was 95% white. By 2000, the white population only made up 23% of the city. By 1980, the city was 47% black, but by 2010, the African-American population had declined to 27%. In 1990, the “Other” population (mostly Asians and Hispanics) was 24%. By 2000, that number exploded to 42%.


When people talk about living in Oakland, inevitably the topic of crime comes up. Rates of violent crime are much higher in Oakland than in San Francisco and Berkeley. The below chart shows the number of reported crimes per 100,000 inhabitants.

At the same time, the number of police officers in Oakland has been falling over the last four years.

There are only 157 officers per 100,000 residents of Oakland, compared to 265 officers per 100,000 residents of San Francisco. The average police officer in Oakland has 5 times as many violent crimes to deal with as one in San Francisco.

Conclusion
Oakland is changing rapidly. Rents have increased 33% over the last two years, the long term population stagnation trend has reversed, and the city is home to a diverse population with (relatively) low income inequality. People frequently comment that there is a lot of crime in Oakland, and the data indicates that they are right. But Oakland is changing fast, and that too could change.
This post was written by Rohin Dhar. Follow him on Twitter or Google Plus. To get occasional notifications when we write blog posts, sign up for our email list.