


![]()
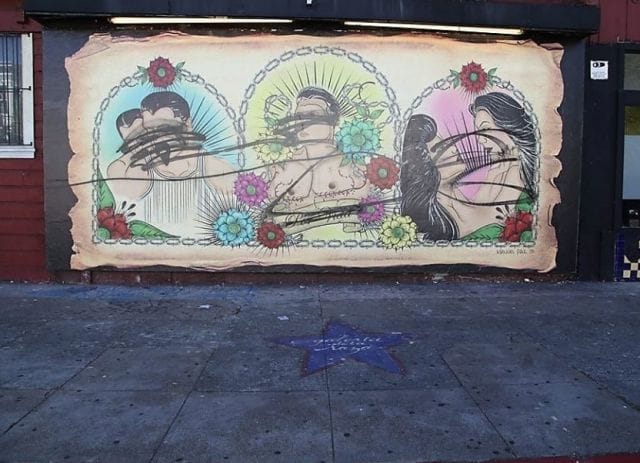
Several weeks ago, in the heart of San Francisco’s Mission District, a mural was born.
Depicting a pair of queer couples and a transgender man, along with the inscription “Por Vida” (“For Life”), the artwork was meant to be a vibrant symbol of the LGBTQ [Lesbian, Gay, Bi-sexual, Transgender, Questioning/Queer] community, which represents 15.4% of the city’s population. Someone, it turned out, didn’t see it that way: three days later, the artists awoke to find their work buried beneath thick lines of blue and red spray paint. They replaced it, this time flanking it with four 360-degree security cameras, and two intermittently patrolling police officers. But the effort was for naught: before the night had passed, it was defaced again.
Last night, just two days after Pride Parade, a third incarnation of the mural was lit aflame. If not for the diligence of a watchful neighbor, the whole building would’ve likely burned to the ground.

In the wake of Friday’s Supreme Court ruling legalizing gay marriage in all 50 U.S. States, this act of intolerance is a sordid reminder of how prevalent LGBTQ-motivated hate crimes still are. Though local and Federal Government data show that these crimes are on the decline, the scope of these crimes is much bigger than a cursory glance suggests.
***
In San Francisco, as in many other jurisdictions, a hate crime is defined as “any criminal act or attempted criminal act directed against a person(s), public agency, or private institution based on the victim’s actual or perceived race, nationality, religion, sexual orientation, disability, or gender.”
Since 1990, the duty of compiling and tracking these crimes has rested on the shoulders of the San Francisco Police Department’s Hate Crimes Unit. A look through the department’s very limited data (running only from 2004 to 2010) yields shockingly low numbers, and a steep decline in crimes committed:
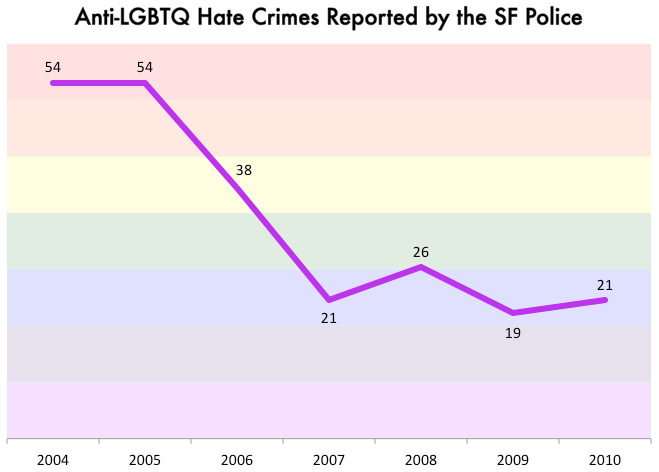
Zachary Crockett; data via the SF Police Dept.
The reason these figures are so low is twofold. First, as Sneh Rao of the San Francisco Human Rights Commission tells us via email, “underreporting of LGBTQ hate violence is a significant issue:” it is estimated that less than half of all LGBTQ hate crimes are reported to the police.
The other issue is that even those crimes which are reported to authorities are rarely identified and prosecuted as “hate-motivated” crimes. Earlier this year, for instance, Samantha Hulsey, a transgender woman, was riding a bus in San Francisco when a man began verbally assaulting her: “He started calling us faggots,” she told ABC News, “and started on this tirade about us being transgender women and defrauding people by pretending to be female.” According to witnesses, the man then removed a switchblade from his coat and stabbed Hulsey twice in the chest. Despite the crime’s apparent motivation, the San Francisco Police Department did not pursue it as a hate crime, and stated that it “did not meet the necessary criteria.”
To get a better idea of the true scope of hate crimes against the gay community in San Francisco, representatives at San Francisco’s Human Rights Commission suggested we take at look at data collected by Community United Against Violence (CUAV), a long-time anti-violence non-profit in the city. Like the city’s police department, CUAV has been tracking hate crime data since the 90s; unlike SFPD, the organization collects data by acting as a community resource that is more deeply and passionately invested in the LGBTQ community.
While their data also shows a dramatic decline, the figures they’ve culled are up to 10x higher than those reported by the police:

Zachary Crockett; data via CUAV hate crime reports, and the SF Police Dept.
Low government-reported figures are not limited to San Francisco.
On a federal level, collecting data on hate crimes has been the job of the FBI’s Uniform Crime Reporting Program since the passage of the Hate Crimes Statistics Act in 1990. The FBI culls its statistics from local police stations, which, as we’ve mentioned, comes with several problems: First, the majority of hate crimes go unreported to police. Secondly, it is entirely voluntary for local police stations to submit their hate crime data to the FBI, and many choose not to bother, or don’t have hate crime divisions. Beyond these reasons, even thedata that does make it to the Feds is flawed, as there is no standard, uniform survey instrument used for reporting crimes.
For these reasons, says CUAV, “FBI [hate crime] statistics are rendered meaningless.”
A more inclusive depiction of LGBTQ hate crimes on a national level comes from the National Coalition of Anti-Violence Programs (NCAVP), which uniformly curates hate crime reports from dozens of city and county-wide activist groups that are directly involved with the community — CUAV included. Here’s how their data compares with that of the FBI:
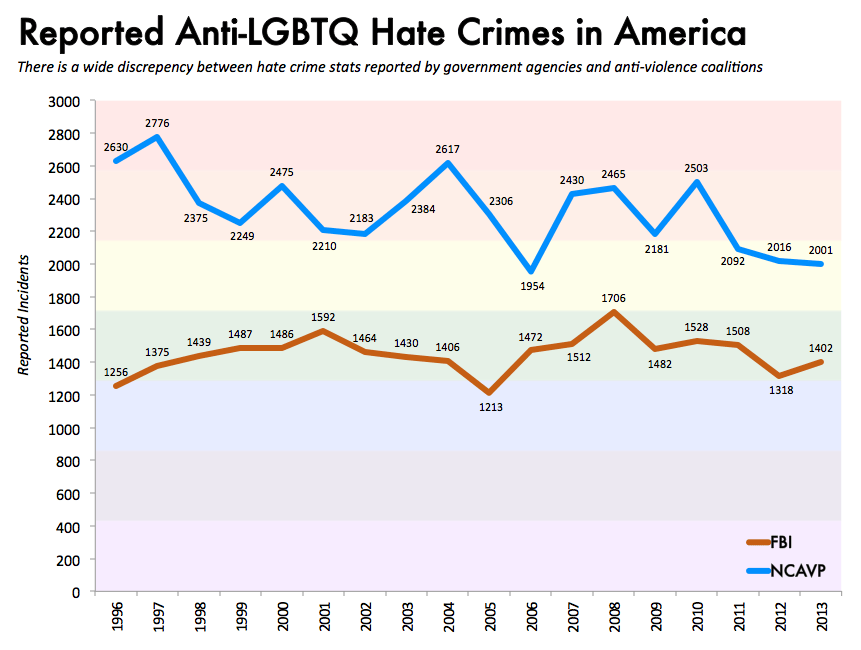
Zachary Crockett; data via NCAVP hate crime reports (1996-2013), and the FBI
Over a 19 year period, NCAVP collected an average of 2,274 hate crime reports each year on a national level — nearly 66% more that the FBI’s average of 1,372 per year. While San Francisco’s data shows a sharp decrease in hate crimes, the national decline of hate crimes since 2007 has been far more gradual.
Behind the veil of this gradual decline lie some unsettling trends.
When broken down by crimes per month, NCAVP’s data shows that there is a considerable, consistent spike in gay hate crimes during the summer months — particularly leading up to and following most U.S. cities’ Pride Parades. In general, all crime tends to occur more frequently in warmer months, but the spike we see here is much steeper.
As the NCAVP explains, LGBTQ hate crimes are often magnified during times when the community has increased visibility and empowerment. (This may partly explain the backlash against San Francisco’s mural.)
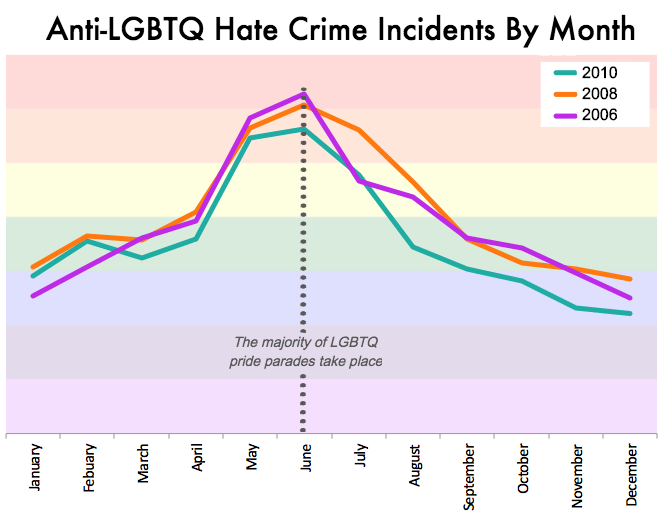
Hate crimes against the LGBTQ community spike in the months of May through July, precisely when the majority (166 of some 220) of pride events in the U.S. occur; data via NCAVP hate crime reports (1996-2013), and the FBI
Because the NCAVP’s data is gathered through local, community-involved activist groups who are working directly with victims, it also paints a much more descriptive picture than the federal authorities as to what these hate crimes entail.
In its annual report, the coalition breaks down reported hate crime incidents by the specific type of crime committed against the victim — many of which are still physically violent confrontations:

Zachary Crockett; data via NCAVP hate crime reports (1996-2013)
Nearly a quarter of all hate crimes committed against the LGBTQ community involve some form of physical or sexual violence. Within these offenses, the gravest crime — bias-motivated homicide — has increased in frequency over the past 15 years:

Zachary Crockett; data via NCAVP hate crime reports (1996-2013)
As we’ve explored, while numerous agencies report a decline in LGBTQ hate crimes, both the scope and viciousness of these crimes is often lost in translation.
Meanwhile, in San Francisco — the bastion of the modern gay rights movement — the community will not allow an act of biased hatred to lapse its recent, long-awaited victory. As the city’s police department dwells over whether or not burning the LGBTQ-themed mural qualifies as a hate crime, community activists prepare to bunker down and continue defending their civil rights.
“The emotional trauma our neighbors and local communities have suffered is unacceptable,” says Galería de la Raza, the organization behind the mural. “We must find ways to heal.”
![]()
This post was written by Zachary Crockett. You can follow him on Twitter here.
To get occasional notifications when we write blog posts, please sign up for our email list.