


Source: Information is Beautiful
If this 2010 data is any guide, fewer couples broke up this week than any other. Although only because so many people already broke up during the weeks leading to the holidays.
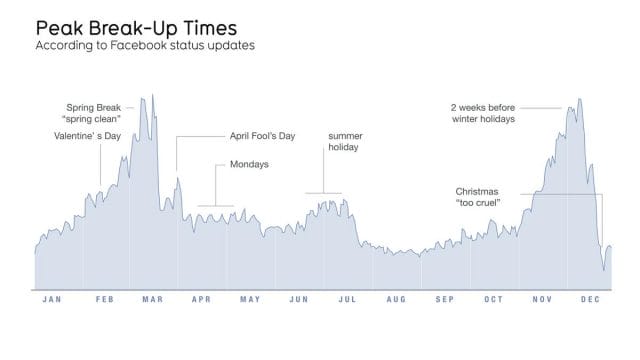
The above graph comes courtesy of two information designers: Lee Byron of Facebook and David McCandless of the excellent Information is Beautiful blog of data visualizations. To create the graph, the two searched 10,000 Facebook statuses for phrases like “we broke up because.” The result is a visual guide to “peak breakup times,” at least among a sample of the Facebook population.
Some common dating knowledge, like the Turkey drop of college students getting out of long-term high school relationships, as well as the rush to become single for spring holidays, seem to be vindicated. (We don’t know if the sample is mostly college students; it’s interesting to speculate why these trends hold among older couples.) Other trends — the tendency to dish out breakups on Mondays — are new.
While a large number of people pretended to breakup with a significant other for April Fool’s (to trick their friends, we hope, not their boyfriend or girlfriend), breaking up over Christmas still seems, as the graph’s creators write, “Too cruel.”
To get occasional notifications when we write blog posts, sign up for our email list.