


This post is adapted from the blog of Weddington Way, a Priceonomics customer. Does your company have interesting data? Become a Priceonomics customer.
![]()
With Valentine’s Day right around the corner, the consumer frenzy has commenced: heart-shaped boxes of chocolates, roses, and a panoply of frilly cards line shelves across America. And with all the love in the air, something else is abounds: marriage proposals.
February 14th is among the most popular days of the year to get engaged, trailing only Christmas (December 24th-25th) and New Year’s Eve (December 31st). Winter, in general, seems to induce men and women to pop the question, as 30% of all engagements occur in November and December.
Given that we’re in the heart of engagement season, we wanted to quantify some of the specifics of American proposals. While data on average marriage age exist, there isn’t much out there on the specifics of engagements.
So, we surveyed 1,000 recently-engaged Weddington Way customers (all women), posing questions like: How old were you when you got engaged? How old was your partner? And, how long were you dating prior to your engagement? After compiling these responses, we sorted them by geographic region (West, Midwest, South, and Northeast).
We determined that the median engagement age in the United States is 27.2 years for women, and 28.7 years for men — a 1.5 year difference. Furthermore, the median amount of time a couple dates before the proposal is 3.3 years. But as we found, these numbers vary based on where you live.
Where do men and women tend to get engaged at a younger age (or older age)? And where do couples date each other the longest (or shortest) before making the ultimate commitment?
***
We began by asking our survey respondees how long they’d dated before getting engaged. So first, let’s take a closer look at how exactly the results break down:

Data via Weddington Way survey
Overall, Americans tend to move pretty quickly: nearly half of all engagements occur two years or less into a relationship. On the other end of this spectrum, only 6% of couples date for 8 years or more before getting engaged.
As we mentioned, the average dating time before engagement is 3.3 years — but does this figure fluctuate by region?

Data via Weddington Way survey
Though by a relatively small margin, couples in the South spend the least time dating prior to engagement. At an average of 2.9 years, Southerners date about 5 months less than the average American before slipping a shiny ring on a finger.
On the other hand, Northeasterners tend to date the longest, at 3.9 years — a full 12 months more, on average, than Southerners.
So, after the dating phase is over, at what age do men and women typically get engaged? Here’s the full strata of how our respondents answered:

On average, women (27.2 years) tend to be 1.5 years younger than their partner (28.7 years) at the time of engagement. About 2.2% of Americans get engaged under the age of 20, 74% in their 20s, 15% in their mid-30s (30-34), and about 8% at the age of 35 or older.
Regionally, the average ages for men and women are surprisingly consistent — with a few surprises.

Data via Weddington Way survey
While there is little variation in female engagement age in the West, Midwest and South, women in the Northeast get engaged slightly later: there is nearly a one year differential between them (27.8 years) and women in the South (26.9 years). This is primarily driven by New York and Pennsylvania, where our average respondent’s engagement age hovered around 28 years old.
When we limit our data to just women and men engaged under the age of 24 years old, the Northeast’s propensity for older engagements becomes even more apparent:
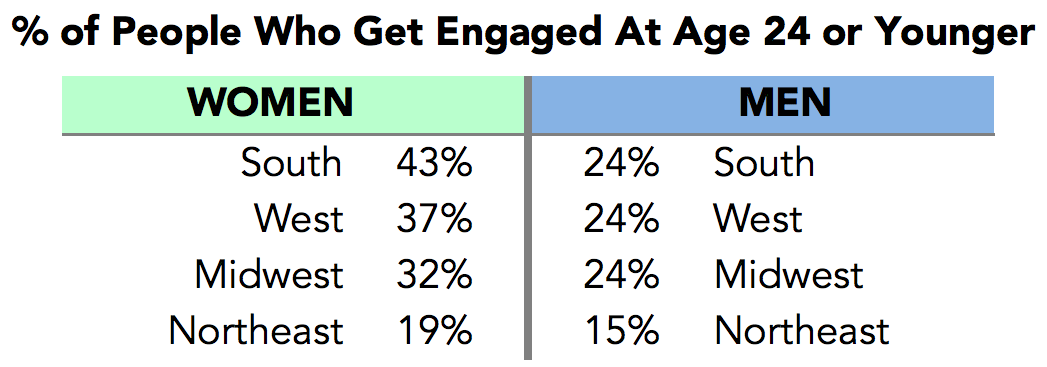
Data via Weddington Way survey
Only 19% of women in the Northeast get engaged at age 24 or younger. Meanwhile, in the South, this figure is more than double, at 43%. Men in the Northeast present a similar case, with nearly 10% less engagements below age 24.
In the West, the relatively high percentage of younger engagements might be partially explained by Utah, where 60% of the population are of the Mormon faith. In the Mormon culture, young marriages are common, with the average hovering around 23 years of age.
Contrarily, where do people get engaged at older ages?

Again, women from the Northeast bottom out this list (only 4% get engaged at age 35 or older). Northeastern men tell a different story: a whopping 16% get engaged over age 35 — more than get engaged below age 24.
In our map above (“At What Age Do Couples Get Engaged?”), the Northeast features the largest age division between women and their fiancés, at 2 years. It seems that this is at least in part driven by a much higher percentage of 35+ year old men getting engaged in New York than 35+ year old women.
***
Whether or not you and your significant other decide to get engaged this Winter (or perhaps you’ve already checked that off the list?), we wish you a festive, romantic Valentine’s Day.
And if you’re over the age of 27.2 and single, take note that the age of engagement (and marriage) has been on the rise for years: in 1990, the average woman tied the knot at 23. The norm for what constitutes as “marriageable age” changes quickly in America.
![]()
In our next post, we take a look at dishes that were once in vogue, but no longer on modern menus. To get notified when we post it → join our email list.