


This post is adapted from the blog of Craft, a Priceonomics Content Platform customer. Want to learn more about the platform? Contact us here.
***
According to McKinsey, $233 billion was invested in private equity in 2017. Unlike public equity, private equity is mostly held by General Partners who manage the private equity funds, and Limited Partners, who invest in those funds. Pension Funds are, in fact, the largest Limited Partner in the private equity sector.
Below, we look at the published Private Equity returns of one of the largest LPs, CalPERS, the California Public Employees’ Retirement System. CalPERS is a government agency which manages the largest pension fund in the United States for more than 1.6 million public sector employees in California. The data set provides a rare peak into the previously undisclosed financial returns of private equity firms.
CalPERS’ investments are distributed among the following asset classes: Cash Equivalents, Debt Securities, Equity, Derivatives, Real estate, Private Equity (private market), Infrastructure (private market), Forestland (private market)
Focusing on Private Equity CalPERS has invested in a total of 235 funds across 92 firms.
While the private equity asset class typically includes early stage venture capital, CalPERS invests mostly in later stage buyout funds. CalPERS may hold other venture capital investments through funds of funds, i.e. some of the 235 funds may themselves be investors in venture capital funds, however this is not disclosed. In this analysis, only one of the firms in the portfolio is specifically known to be a venture capital fund – Khosla Ventures (and the fund data available for Khosla may not include all their funds).
In the table below, we show the top twenty performing private equity funds ranked by IRR:

Data source: Craft
Across the 235 funds, the median vintage year – the year during which CalPERS invested in a particular fund – is 2007. Cash In represents the total amount of money that CalPERS has invested. Cash Out is the total amount of cash that CalPERS has realized, or withdrawn. Cash Out & Remaining Value represents the total value of the fund as of December 2017, including the cash withdrawn.
Looking at all 235 funds, we see that the median total fund value is $238M and the median total Cash In is $168M, which is a 51% increase since 2007.
If we compare this to the S&P 500, the Private Equity return underperforms public equities. From January 2007 to December 2017, the S&P 500 Index increased from approximately 1400 to 2700, up about 93%.
Next, we consolidated the 235 funds into their respective firms. We took the percentage of Cash In of each fund versus the Total Cash In across all funds within a firm, and computed a weighted average of Net IRR, or Internal Rate of Return. The following table contains the 20 best performing CalPERs Private Equity firms by Average Net IRR: 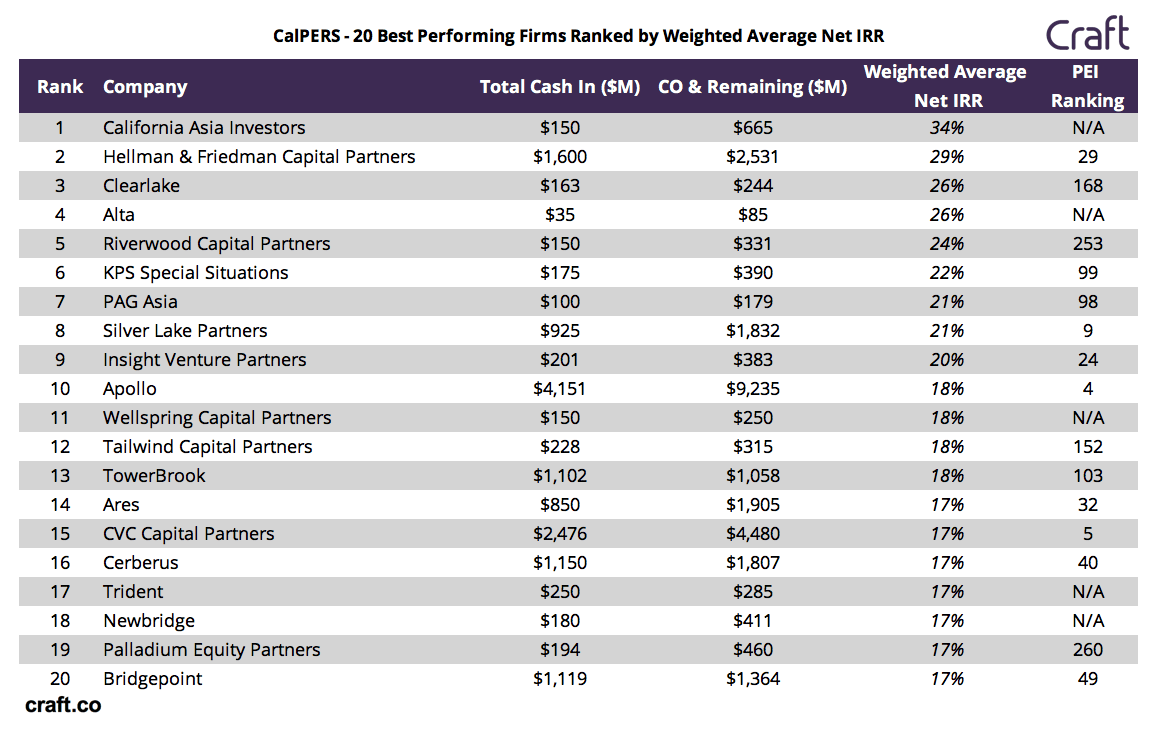
Data source: Craft
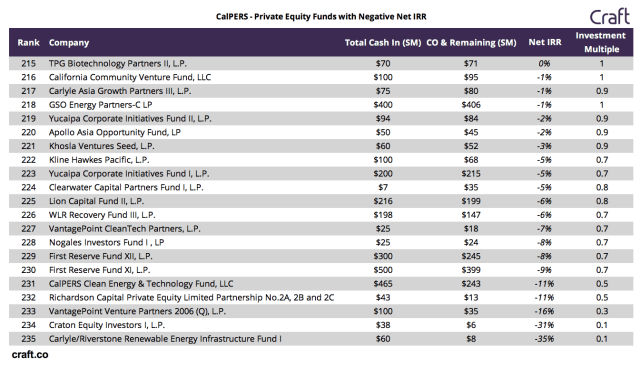
Out of the 235 funds invested (those invested during 2017 are omitted), only 21 have a negative Net IRR:
Data source: Craft
The funds with TPG, Apollo, and Carlyle are ranked 10, 4, and 1 respectively as the best Private Equity firms.
In summary, the Total Cash In is a massive $55.5 billion and the Total Cash Out is $62.4 billion. This means that the total realized amount is $6.9 billion, 12% of total Cash In, with a median vintage year of 2007. With CalPERS’s $326 billion in AUM, Private Equity accounts for 17% of the entire portfolio.
Key Takeaways:
- While CalPERS private equity portfolio has increased by more than 50% for the past 11 years, the S&P 500 has increased more than 90%.
- CalPERS has realized a return of 12% in total – the balance remains in portfolio companies, as Private Equity investments take long to mature.
- Most Private Equity funds in the portfolio (91% of the 235) have returned a profit.