


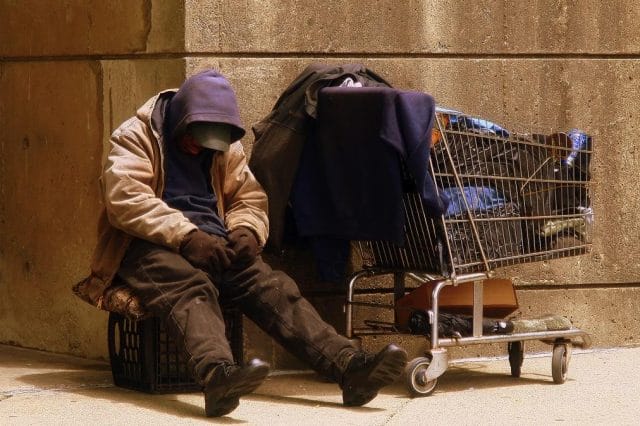
A homeless man on the streets of Boston
Imagine you’re the mayor of a city plagued by widespread homelessness. Every local aid program claims to be underfunded, but you have no idea if any of them are effective at actually moving people out of homelessness. Federal grants exist to assist cities like yours with homelessness, but to apply for them you need to submit hard numbers about the size of your city’s homeless population. In the meantime, a large percentage of voters aren’t convinced that homelessness is a problem in the first place, and your political opponents allege that the issue is nothing more than an excuse to throw money at your bureaucratic cronies.
In short: you desperately need data about the city’s homeless population. A good place to start would be to find out how many people in your city are homeless.
It might seem easy. Here’s why it’s not: For starters, you can’t mail them Census forms at their “usual residence” because they don’t have one. They certainly don’t have land lines, so telephone polling is out. Shelters and other service-providers can survey the people they service, but the same people can visit different organizations day-to-day or hour-to-hour (which would lead to overcounting), and other homeless people — known as the “unsheltered” — don’t use shelters at all (which would lead to undercounting).
Homeless people have got to be one of the hardest groups to gather accurate data about in the world. Which makes the plethora of headline-worthy, statistical claims about them seem a little confusing. Like: in 2013, North Dakota had the fastest-growing homeless population of any state. Or: New Orleans, Phoenix, and Salt Lake City have all ended chronic homelessness among veterans.
Or: On a given night in January 2013 there were 610,042 homeless people in America, and 35% of them were unsheltered.
Where do these numbers come from? How are they gathered? Who is included, who isn’t, and how do institutions have enough confidence in these numbers to actually use them?
The History of Homelessness Data
Homelessness in America today is very different than it was 40 years ago, statistically speaking. In the 1980s, the number of homeless people in the United States ballooned — following a deteriorating economy, a national trend towards deinstitutionalization of mental health care, and federal cuts to low-income housing programs.
Exactly how big this surge was, is hard to say: neither federal, state, nor municipal governments were gathering reliable data at the time. But we know it happened, partially because local institutions that serviced the homeless across the country overflowed. Shelters and kitchens had to move into to larger facilities to accommodate a higher volume of people. Local neighborhood shelters became homeless shelters when homelessness became one of the biggest issues facing their communities.
Eventually the homelessness phenomenon became too big to ignore, politically. New legislation was passed to provide funding for the service of homeless people. But in order to so that effectively, and in order to prove their own efficacy, these programs needed reliable data on homeless populations.
1984 was also when the Department of Housing and Urban Development (HUD) published the first national point-in-time study of homelessness. Point-in-time studies offer “snapshots” of the homeless population at a particular point in time, making it much less likely that any individuals are double counted (HUD now recommends limiting them to only a few hours). But for the PIT study of 1984, HUD only sampled urban shelters. As a consequence, their extrapolated estimate of the national sheltered and unsheltered homeless population was imprecise to say the least: between 192,000 and 586,000 people.
Now, HUD relies on an impromptu army people it refers to as “enumerators” — either volunteers, or contract employees in communities where such help is difficult to recruit — to go out into the night and tally the unsheltered homeless.
Every community applying for federal grants for homeless assistance has to submit these unsheltered point-in-time counts every other year. HUD accepts a variety of count methodologies. Some communities — like New York City — still only sample a fraction of their geography, and statistically extrapolate a city-wide population. Communities like San Francisco try to count on every block. Some communities conduct interviews, especially if they have to time their count out over several days and needs to screen their data for duplicates. Other communities, which lack both the manpower to do a comprehensive count, and the statistical expertise necessary to extrapolate from a sample, simply provide raw counts from the sampled areas.
Still other communities survey the users of a range of non-shelter services widely used by homeless people (soup kitchens, public housing agencies, free clinics), asking individuals if they were homeless on the night selected for the point-in-time count, and, if so, if they were unsheltered. Communities typically conduct these surveys over a period of several days and then screen out duplicates before compiling them into a comprehensive count of unsheltered individuals.
These communities also work with homeless shelters to annually submit counts of the sheltered homeless populations in their area. HUD’s widely-quoted point-in-time statistics on national, state, and citywide homelessness — including all of the statistics in the introduction to this article — come from one of these various metrics, or the synthesis of many of them.
A Rag Tag Team Of Data Collectors
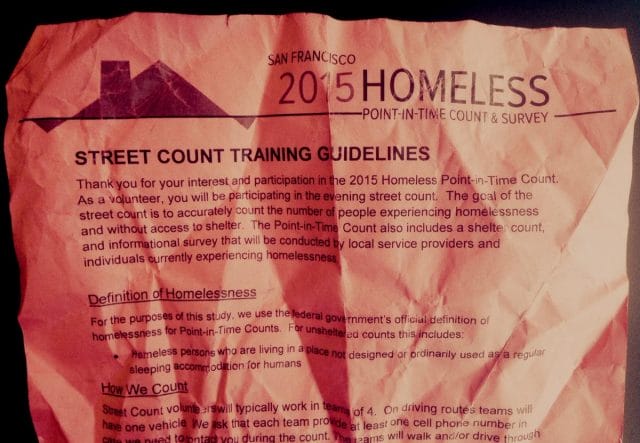
Enumerator training document; San Francisco 2015
At 7:30 on Thursday, January 29, dozens of volunteers — the author included — congregate in the Centro Latino Community Center, in the Mission District neighborhood of San Francisco. There are three other centers like it in different parts of the city, and more than 500 volunteers citywide. “Our goal for tonight is accuracy in what we’ve been asked to measure,” a coordinator says, addressing the crowd. “Tonight you’ll be asked to count individuals residing on the street or in a place not meant for human habitation.”
She goes over the basics: volunteers will assemble into teams of two to five. Together, they’ll be given an area of the city to comb, block by block — either by foot or by car — for homeless people. Each person observed will be marked on a scantron-like form with a few fields of detail: the person’s gender, their age range, and their kind of shelter, if any (van, tent, tarp). They are not to count people located outside their assigned area — even if just across the street. If unsure whether or not somebody they observe is homeless, they are to consult amongst each other and use their best judgment and knowledge of the community. They are not speak with the people they are counting.
“While there are many of you in this room,” the organizer explains, “there are not enough of you to engage in this way and return before midnight.” Another motive against interviewing the count subjects emerges when a pair of police officers brief the volunteers on how to go about the count safely, “Observe from a distance. Your safety comes first.”
Then it’s assignment time. Volunteers who came with cars stand in front of the room until they’ve gathered a team of at least three, while walking teams self-organize. An organizer, observing the crowd — city employees, retirees, groups young people wearing matching t-shirts, and loners of all walks of life trying to figure out their next move — announces: “We probably have a lot of people here who want to be walking. If you came as a group of three, there are people who came here by themselves who want to be part of your team. Let them be part of your team.”
A few minutes of chaos ensue, through which several drivers remain, teamless at the front of the room. The author, thinking to herself, “What is this, kickball?”, joins a driving team with a woman who works for the city of San Francisco, in the human services agency, and a woman she just met who works for a non-profit that provides services to homeless people. The organizers hand them a map. No one in the team has had dinner, so they pick up snacks on the walk to the city employee’s car, then they make small talk on the way to their assigned neighborhood — a mostly residential area to the south.
The group of strangers may seem a little rag tag, but groups like this are key to current government efforts to measure and fight homelessness.
Parameters and Quality Control

San Francisco Civic Center: home to city hall, and many of the city’s homeless
HUD recommends conducting the count on a weeknight — there’s less foot traffic, making identification of homeless people easier, and shelters typically close overnight, reducing the possibility of someone counted on the street walking into a shelter and being counted again.
One of the few actual requirements HUD imposes is that all point-in-time counts take place during the last 10 days of January. According to HUD’s A Guide to Counting Unsheltered Homeless People (2008), there are three reasons for this: (1) if counts occurred at different times of the year in different cities, individuals might migrate and be counted twice, (2) it’s the “period of greatest environmental threat” in the north, thus the time of year the unsheltered homeless will require the most assistance, (3) because of the Winter weather, homeless people are more likely to seek the solace of a shelter, making them easier to count.
Points (2) and (3) are clearly not true in certain parts of the country, like the Southwest, where the winters are mild and the summers are brutal. The weather in San Francisco is nice year-round, and the night of January 29 is no exception. It’s warm enough in the Mission to walk around without a jacket.
The beautiful night is at odds with the sobriety of the task at hand. As the author and her team begin their route through their assigned area — even though this is a team of strangers, two of whom work with homeless populations professionally — it starts to feel more like a scavenger hunt than a public service. When they see someone who looks like they qualify, there’s a weird tendency towards giddiness: “I see a shopping cart! Did you get him?” “Bingo! Where is this guy going?” “What do you guys think? Homeless or student? Could we even count him? Is he in our territory?”

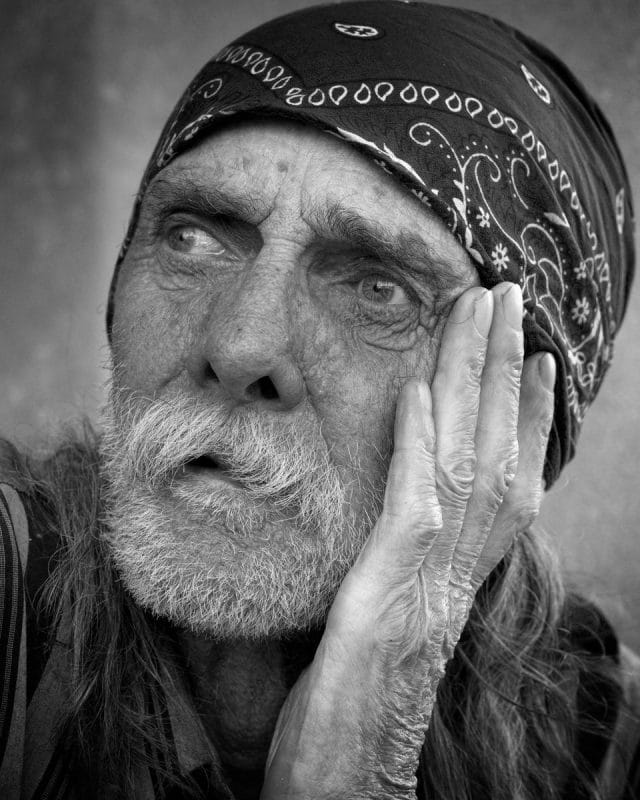
A homeless woman on Haight Street in San Francisco
There’s no escaping the fact that cruising around town, guessing at the suffering of strangers, and categorizing and tallying them on a piece of paper, is an inherently uncomfortable activity. There is a tendency to deal with that discomfort through humor. When it isn’t clear whether or not the team should count someone, someone compares the dilemma to a live, purposeful version of the “Hipster or Homeless?” meme. The team members chuckle, cringe, but go on to discuss the question seriously. It’s important: they’ve been cautioned not to rely heavily on stereotypes. Many homeless people are good at hiding their condition to avoid the social stigma attached to homelessness.
The team’s levity becomes more problematic as the task proves to be surprisingly difficult. After sitting in a car for an hour and a half, mostly staring down at a map, the author becomes carsick. The temptation to slack is obvious: they could stop for a break and risk not completing the count in time; they could pause at intersections, and glance down side streets, instead of actually driving down them; they could use their knowledge of the neighborhood and skip over areas they think they’re exceptionally unlikely to find homeless people.
Enumerator compliance is a perennial concern for counts like these. The US Census conducted the first national point-in-time count of unsheltered homeless populations in 1990. Enumerators were instructed to interview everybody they saw on the street in their assigned area, except for people in-uniform, or clearly otherwise working. The Census placed “observers” in a sample of the areas, to watch for the enumerators and monitor their performance. Observers at 35% of the locations sampled reported that enumerators never showed up at all, and the 65% that were spotted enumerated selectively (in this particular study, enumerators were supposed to interview everyone they saw). (In the Guide, HUD outlines this kind of “Plant-Capture” study, and other forms of audit. They’re only recommended for communities with the resources to execute them, that have reason to suspect systematic inaccuracy. New York conducted one in 2008.)
25 years later, HUD admits that point-in-time data still isn’t perfect. They caution that point-in-time data collection methodologies vary widely from city-to-city, and in some cities from year-to-year, and the quality of the data likely does, too.
HUD also stresses the importance of analyzing point-in-time metrics in conjunction with other data when assessing areas of need and areas of improvement. This is particularly important because there are a lot of people the HUD point-in-time counts miss, who are captured by other homeless statistics.
The US Department of Education released a report saying that in 2013, nearly 1.3 million children enrolled in public schools experienced homelessness. The Department of Education included people living in temporary, non-shelter housing — like hotels and motels, or friends’ homes. And the number of people who experience homelessness at least once, over the period of a year, is much higher than the number of people who experience homelessness on a single night. Only 18% of homeless people counted in 2013 qualified as “chronically” homeless — either continuously homeless for a year, or homeless four times over the past three years. The rest had been made homeless relatively recently.
First, San Francisco
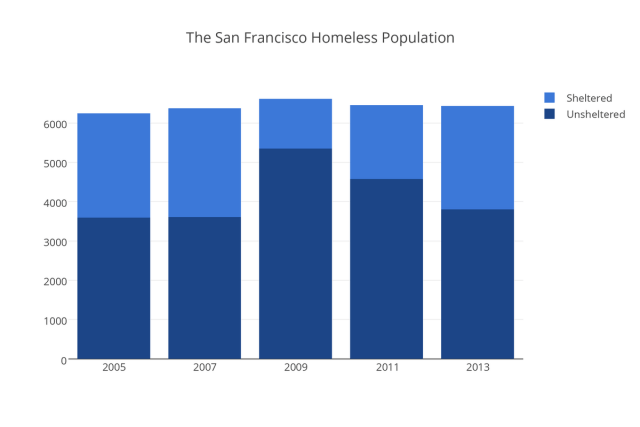
San Francisco’s homeless population over time; Data: SF Homeless Services via San Francisco Chronicle
According to the count, San Francisco homelessness has been more or less static for the past 10 years. The last count was in 2013 and found 6,436 homeless people, 2,633 of them on the streets. There was no city-wide unsheltered count in 2014. 2015’s statistics will not be released for several months, but when they are, the author’s contribution will be among them.
Her team does not give in to temptation and completes the count by the rules. The neighborhood the team has been assigned is sleepy, relatively affluent, and there are few homeless people to count. But they do spot a few people, and find evidence of homelessness in surprising places. Several vehicles parked around a park’s perimeter look like full-time shelters, and the team marks them on their sheet.
“A major benefit of conducting a count of unsheltered homeless people,” the Guide reports a count coordinator in a rural community said, “was that it dispelled the myth that such people did not exist in the community.”
A few miles away on Market Street, Dennis McDonough, President Obama’s chief of staff counted in a walking team alongside San Francisco Mayor Ed Lee. SFGate quoted McDonough as saying, “What I see here, what we just walked through, this is a problem. But this is the same sort of challenge we face all over the country. The numbers tell the story. And that’s why this count is so important.”
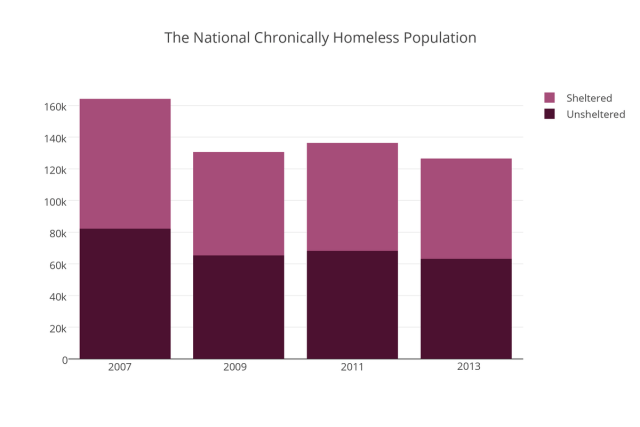
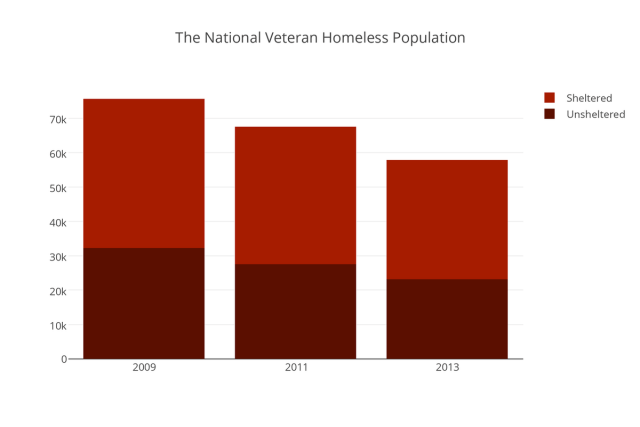
Chronic homelessness (continuous homelessness for a year or more, or more than four episodes of homelessness in the past three year period), and homelessness among veterans are both targeted by federal programs, and are both on the decline; data: HUD
For all its faults, HUD point-in-time data is useful — both nationally and locally. One day before the count, Mayor Lee announced that San Francisco received $25.6 million in HUD grants to assist homeless people. The president and HUD have made it their goal to end veteran homelessness by the end of this year: point-in-time data makes targeted programs like these more efficient, and gives them clear metrics for success. It provides as accurate as possible a picture of a frequently misunderstood and desperately needy segment of American society. Now, if homelessness surges in a community, we have much more granular data than “the shelters overflowed.”
This is how American cities count their homeless. They send hoards of volunteers into the streets with pencils and clipboards. They count them by hand, block by block, one by one. It isn’t easy, it isn’t pretty, and it isn’t clean. But they do what they have to do to make the hundreds of thousands of people living on the streets — invisible and ignored by so much of society for so long — visible to the public eye, a part of public discourse and, when the time comes to make important policy decisions, people who count.
This post was written by Rosie Cima; you can follow her on Twitter here. To get occasional notifications when we write blog posts, please sign up for our email list