


This post is from Cape Analytics a Priceonomics Data Studio customer. Does your company have interesting data? Become a Priceonomics customer.
***
As the pandemic waxes and wanes and we look back on the last 18 months, it’s clear that different types of workers experienced differential economic impacts. On one hand, there are workers who need to be in a location to do their job. Many members of the workforce, including restaurant staff, hotel employees, and those in the events industry saw their financial livelihoods devastated as the pandemic shut down parts of the economy.
On the other hand, we also saw the boom of “Zoom workers”—or knowledge workers who can conduct their work online. These workers typically work from anywhere. For these workers, the pandemic enabled them to move out of the city and work in more rural locations with natural beauty.
As such, the pandemic has given birth to a massive real estate boom in these so-called “Zoom towns” where knowledge workers relocated during the pandemic. These picturesque locations, particularly in the West, have seen a spike in real estate prices.
But there is tremendous risk associated with these growing Zoom towns in rural areas —almost all of them are in high wildfire risk areas. Living in a cabin in the woods seems idyllic until a spark of lightning ignites the forest and endangers your home.
In this analysis, we examine the wildfire risk and property values of popular Zoom towns in the Western U.S. At CAPE Analytics, we use artificial intelligence to analyze vast quantities of geospatial imagery to help insurers and other companies better understand properties and property risk. In this analysis, we look at U.S. Forest Service wildfire risk data, paired with Zillow home price estimates from the Zillow Home Value Index.
We found that the Zoom town with the highest fire risk in our sample is Mariposa, CA, a picturesque town near Yosemite, followed by Springdale, UT, and Lake Arrowhead, CA. Meanwhile, the most expensive Zoom towns in our sample were Aspen, CO, and Carmel-by-the-Sea, CA. The Zoom towns with the fastest price appreciation were Glen Ellen, CA, Truckee, CA, and Big Bear, CA, with annual price appreciation exceeding 25% in each location.
In general, our analysis finds that Zoom towns with lower home prices tend to carry higher wildfire risk. However, these same areas, which carry high fire risk, are also experiencing the highest appreciation in property values, as remote workers drive up demand. For those who deal with risk, such as the insurance industry, this can be a worrisome trend. Not only are more people moving to these higher-risk areas, but the property values (and subsequent potential losses) are growing at unprecedented rates.
Before diving into the results, let’s spend a moment on the data sources and methodology. The U.S. Forest Service provides wildfire risk assessment for much of the United States on a 0 to 5 score ranking system (0 being no risk, 5 being very high risk). We looked at the fire risk scores in cities and towns mentioned in news articles about pandemic relocation trends. This data was then paired with Zillow’s typical single-family home value estimates according to the Zillow Home Value Index (ZHVI) as of April 30th, 2021.
To start, let’s look at the list of Zoom towns we’ve assembled, ranked from the highest to lowest fire risk according to the U.S. Forest Service.
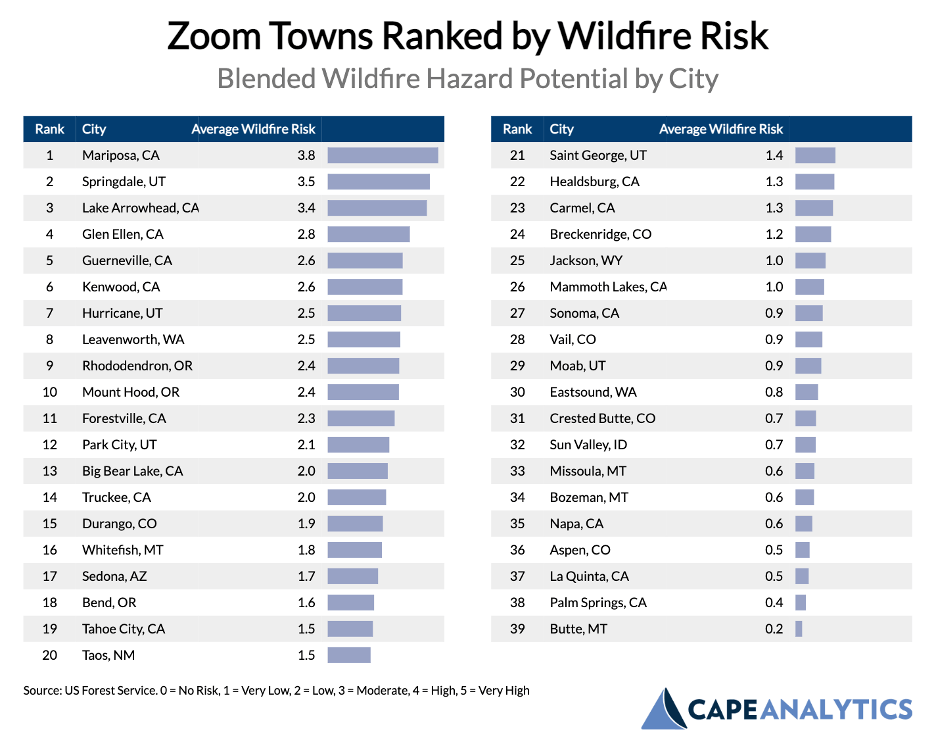
Chart via Cape Analytics
By a significant margin, Mariposa, CA, has the highest average wildfire risk at 3.8. Coming in second place is Springdale, UT, a town near Zion National Park. Lake Arrowhead, a Southern California vacation destination, and Glen Ellen, CA, a town in the middle of Sonoma wine country, round out the top four highest risk areas.
The lowest wildfire risk areas among Zoom towns in the Western United States are Butte, MT, followed by the arid locations of Palm Springs, CA, and La Quinta, CA. It should be noted that even in areas like Napa, CA, which ranks as low as 0.6 fire risk, this score is skewed by the more densely populated portions of each city. In the more rural surrounding areas of each town, the fire risk can be extremely high.
Next, we wanted to quantify the typical home price in each of these Zoom towns. The following chart ranks homes by typical value, according to Zillow, and compares those values to each town’s wildfire risk.
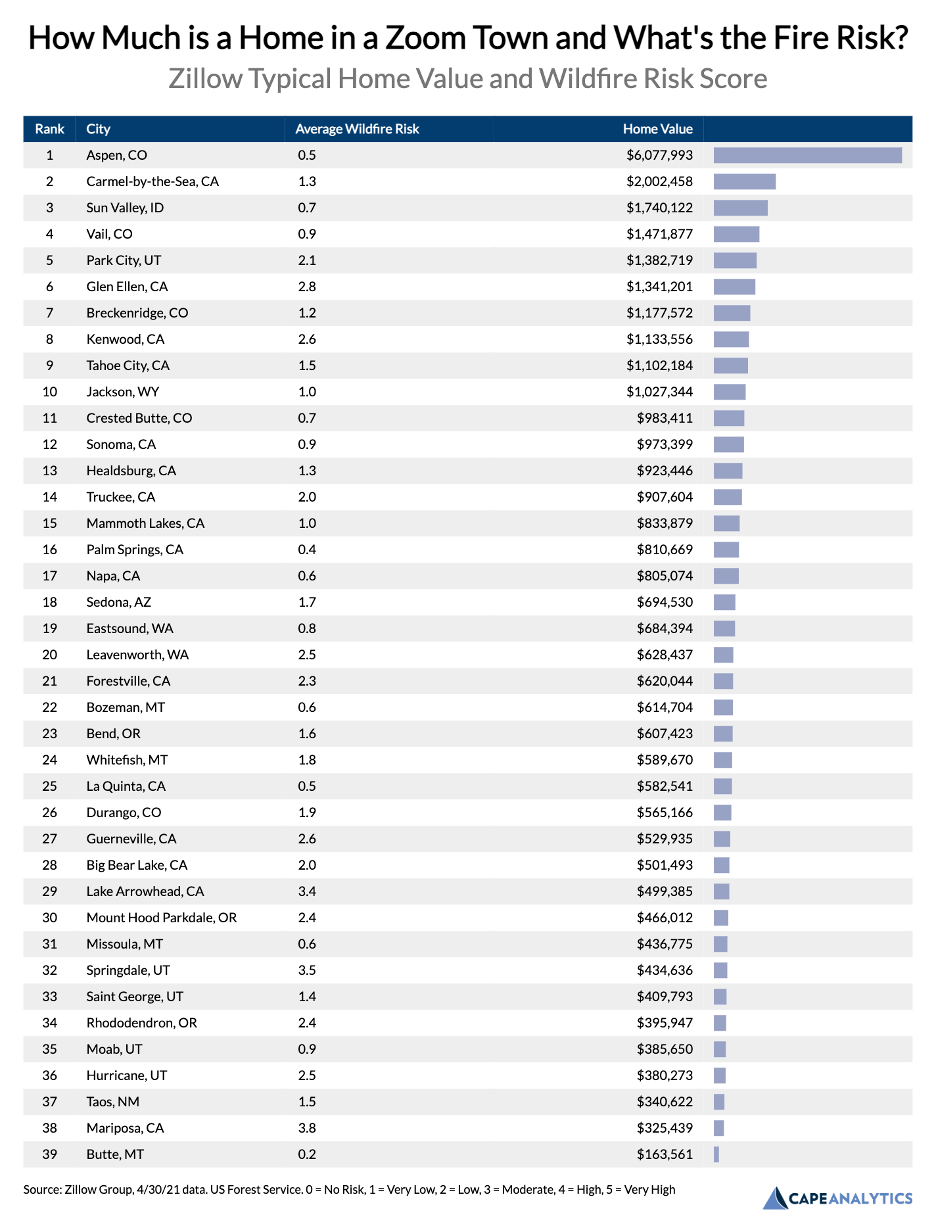
Chart via Cape Analytics
Aspen, Vail, Sun Valley, and Park City, all small Western ski towns, make up four out of the five most expensive places. In second place is Carmel-by-the-Sea in California. All of these top five areas have relatively low wildfire risk on average. The least expensive Zoom towns in our sample are Butte, MT, Mariposa, CA and MT, Taos, NM. In Butte and Taos, at least, the wildfire risk is lower than the typical city in this study.
How do home prices correlate with fire risk in these idyllic rural locations? The following chart shows the Zillow home values segmented by wildfire risk bucket.
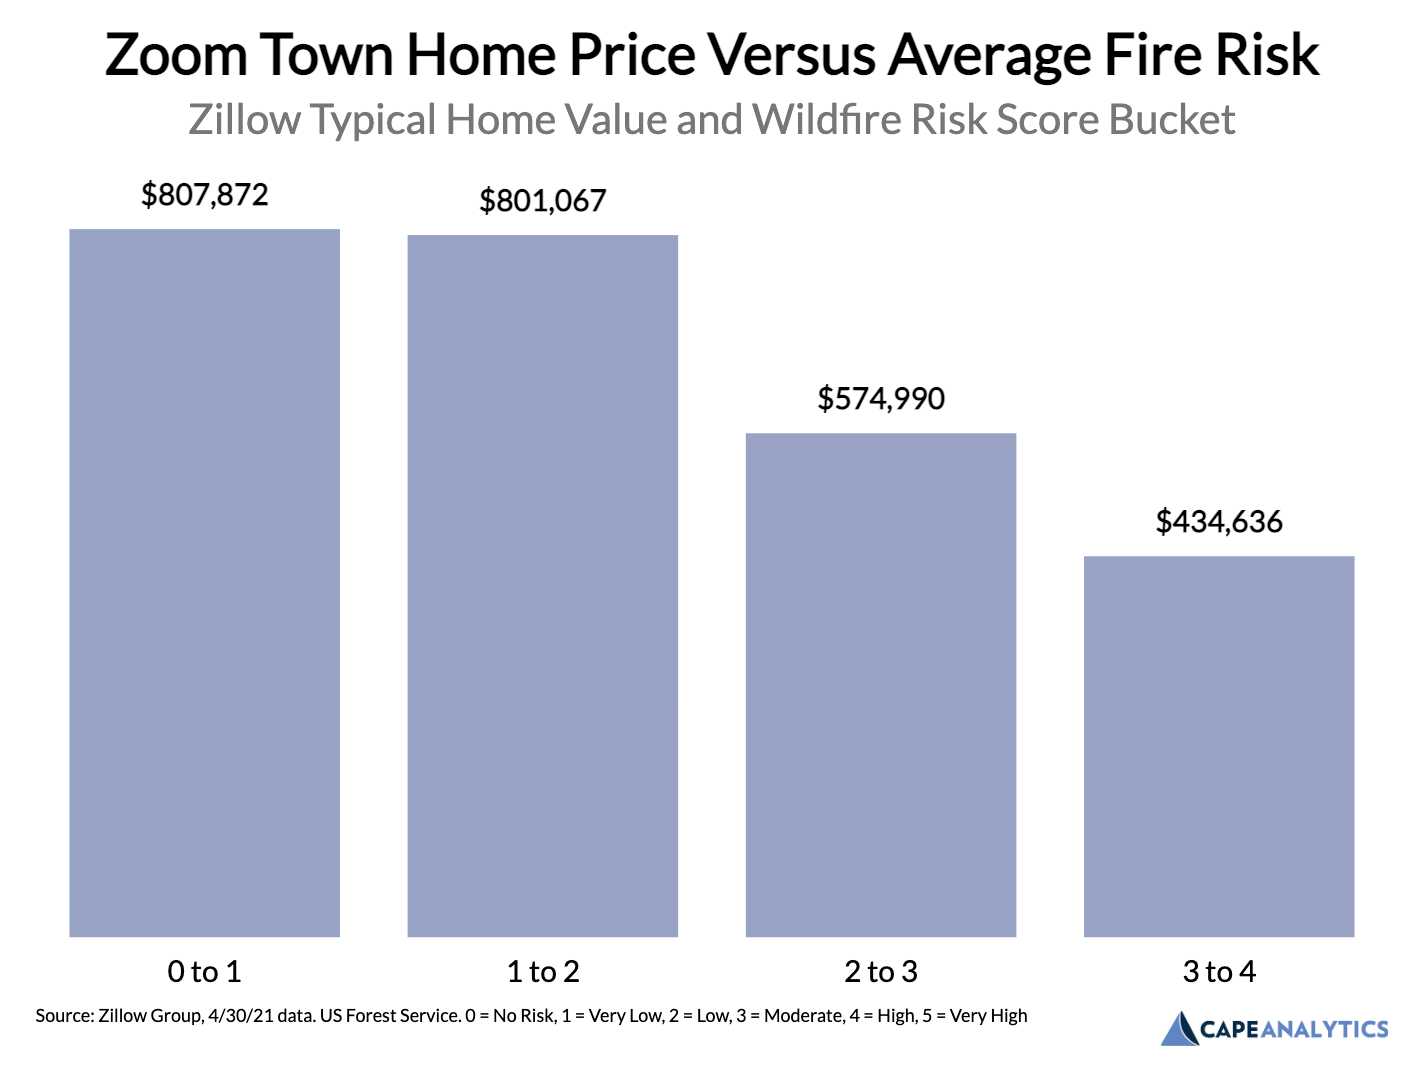
Chart via Cape Analytics
In general, the more wildfire risk in the area, the lower the home prices. Homeowners insurance is higher in fire-prone areas (or impossible to obtain), which may also help drive down home prices. Another possible explanation is that homes in particularly high-risk areas tend to be more remote, closer to wildland, and further away from amenities that drive up home prices.
Finally, let’s turn our attention to where home prices are rising the fastest over the last year as some people work from home in more rural areas. Below is the chart of the Zoom towns with the largest 1-year price appreciation.
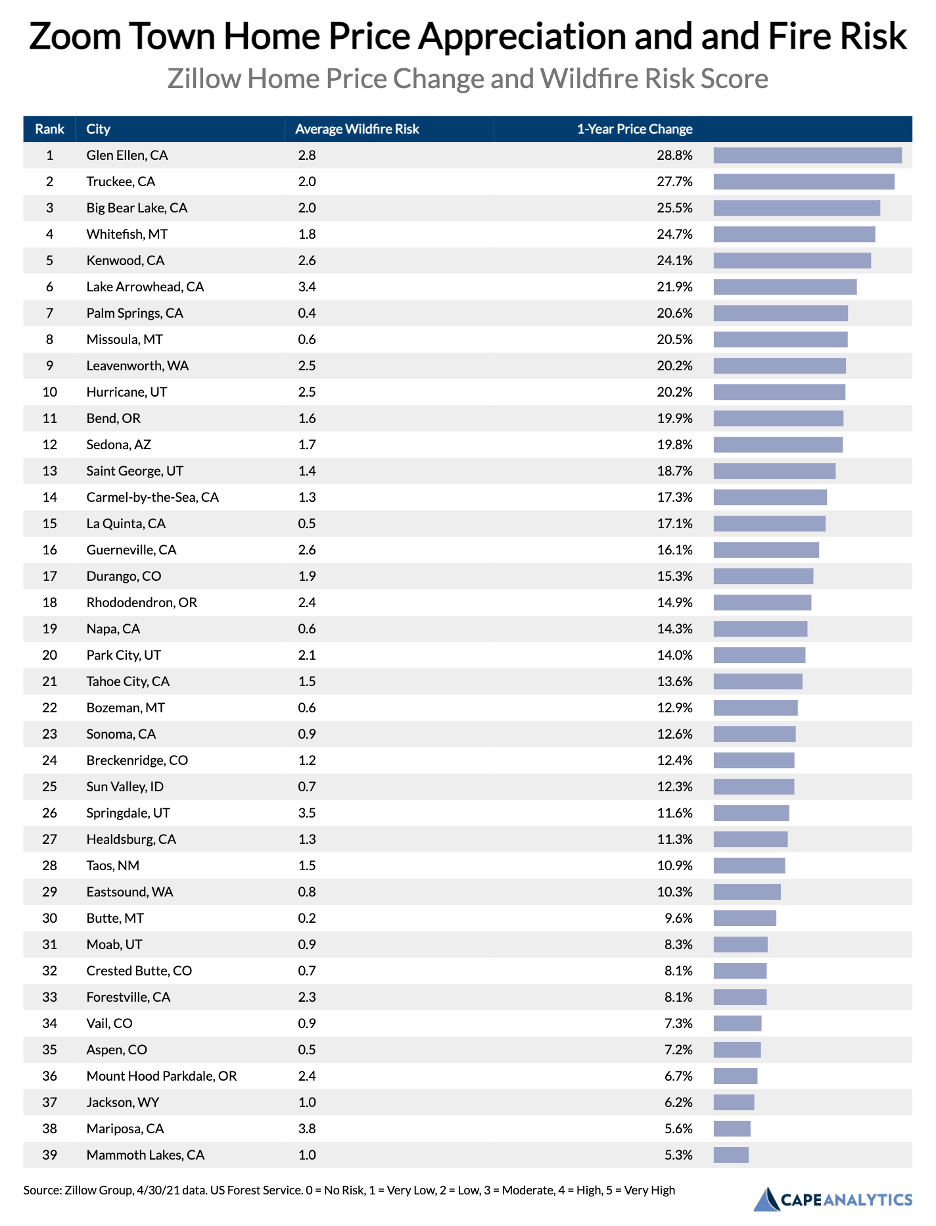
Chart via Cape Analytics
Glen Ellen, a town in Sonoma wine country, has the highest appreciation rate over this last year, with homes increasing 28.8% in just one year. Truckee, the ski town on the California side of the Lake Tahoe area, has had the second-highest price growth in the last year, with homes selling for 27.7% more than the year prior. As Bay Area workers flee to Lake Tahoe, Truckee is a more affordable homeownership option than being closer to the lake in Tahoe City. Big Bear Lake in California also saw price appreciation greater than 25% in one year.
Price appreciation typically is a consequence of increased demand for a given amount of housing stock. The following chart shows the average price appreciation by fire risk cohort among locations:
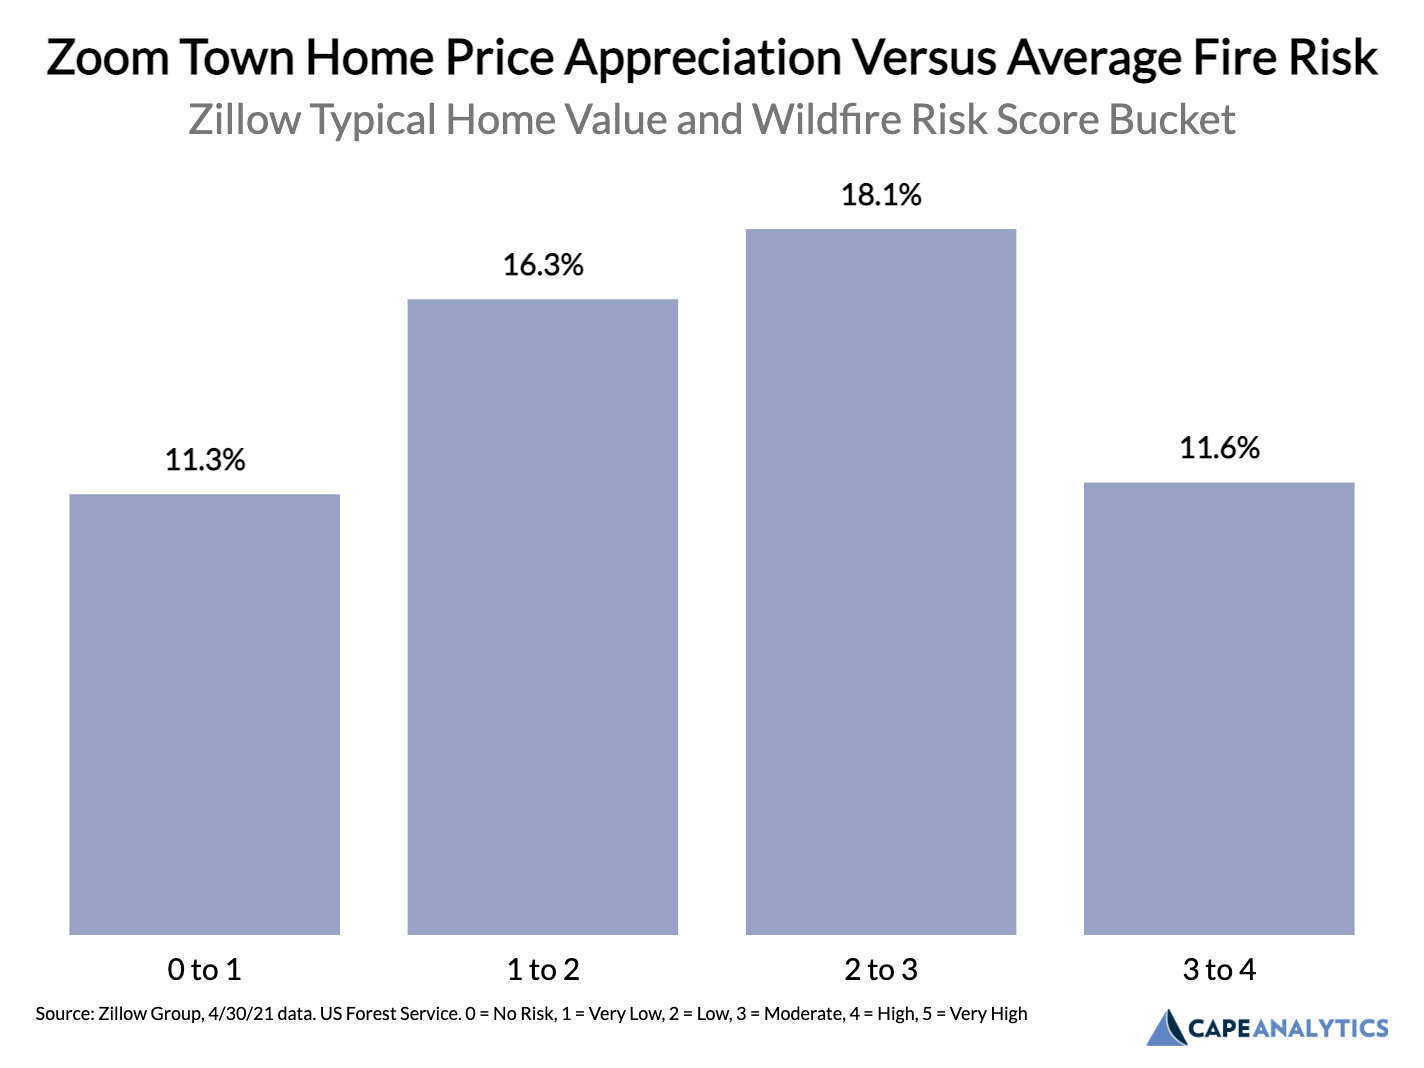
Chart via Cape Analytics
Unfortunately, we have seen a substantial increase in demand for homes that happen to be in high fire risk zones. The highest price appreciation has been in areas with a high fire risk score of 2-3, which includes many areas that have had devastating wildfires in recent years, followed by areas with moderate fire risk of 1-2.
The COVID migratory pattern of people leaving cities has led to an influx of homebuyers in these higher wildfire risk areas. For people fortunate enough to be economically unscathed by the pandemic, working remotely has opened living options. As a result, many are relocating to mountain towns, wine country, or near a picturesque national park. As more demand for rural living leads to more housing and higher home value in those areas, the risk and possible total destructive value of a wildfire increases in turn.
New homeowners in these areas should be aware of this heightened risk and take mitigation measures, such as maintaining a minimum, 10-foot defensible space perimeter between the home and any vegetation. A recent Cape Analytics analysis, for example, shows that clearing vegetation from 10 feet around a home reduces the risk of damage from a wildfire by 80% or more, in very high-risk areas.
As climate change and associated wildfire risk worsen throughout the Western U.S., it’s paramount for government officials, insurance companies, and homeowners to understand the changing risk landscape and the possible negative impacts on people and property.
***
Note: If you’re a company that wants to work with Priceonomics to turn your data into great stories, learn more about the Priceonomics Data Studio.