


A portrait of Russell Poldrack’s brain
Russell Poldrack is not quite an ordinary guy. He eats his breakfast, drinks his coffee, and goes to work. So far, so ordinary. But for a while, he spent a lot of energy meticulously tracking the details of this ordinary, day-to-day existence.
Like many people, he watched what he ate. But he also kept track of absolutely everything he ate. He suffered the emotional highs and lows of human existence, and also kept track of those highs and lows by answering survey questions about his feelings several times a day.
And then there’s this: unlike most people, every Tuesday and Thursday, for a year and a half, Poldrack had his brain scanned in an MRI machine.
Poldrack, a neuroscientist, is both the lead researcher and the only subject of the ultimate quantified self study. Nature Communications recently published his paper on the project, titled “Long-term neural and physiological phenotyping of a single human.”
The “single human” in the title is Poldrack himself. He might be a little extraordinary, but he’s hoping he’s ordinary enough that the study, which analyzes, among other things, his unique, personal patterns of brain activity, is useful in guiding future research.
When People Change, Do Their Brains Change, too?

Laurie Frick sculpture based on years of EEG sleep data (TEDx)
Now at Stanford University, Poldrack used to be the director of the Imaging Research Center at the University of Texas. One of Poldrack’s inspirations for his project was the work of the center’s then artist-in-residence, Laurie Frick.
Frick is a data artist who specializes in human portraiture. She makes visual art pieces and large installations structured around her formidable trove of quantified self data. She elaborated on this in a TEDx talk about her art:
“For me, I decided to run straight toward the data. I got a Fitbit, I measured my steps. I get on a wifi scale every day. I spit in a tube, I got my DNA snippets. I turned on ManicTime on my laptop, it keeps track of everything I do. I open paths on my phone everywhere I’ve gone. I set up an e-mail trigger, and I score how my stomach feels and exactly what I’ve eaten.”
“And there’s some more,” she added, a little sheepishly. The audience tittered and Frick smiled. “But I don’t want to sound nutty.”
In the same talk, Frick noted that the ‘research’ for her art even pushed the boundaries of some of the scientists she worked alongside. She describes a neuroscientist learning of her latest project and asking, pointedly, “Laurie is it possible to have too much data about yourself?”
Poldrack had a radically different response to Frick’s art. Through their conversations, he became more and more interested in tracking his own data more rigorously.
But the project wasn’t driven by narcissism, or at least, not solely. While plenty of people, Frick included, have tracked plenty of metrics about their behavior, mood, pulse, and diet, nobody has longitudinally tracked a brain — not their own or anyone else’s.
What Poldrack really wanted to track was his connectome. An individual’s connectome is the connections between their neurons; it’s what their genome is to their genes. A connectome entails an organism’s entire neural structure, and it can be thought of as the “wiring diagram” for all the organism’s neurons. Much like a genome, that structure could contain a lot of information about who we are, and why we feel what we feel, and do what we do.
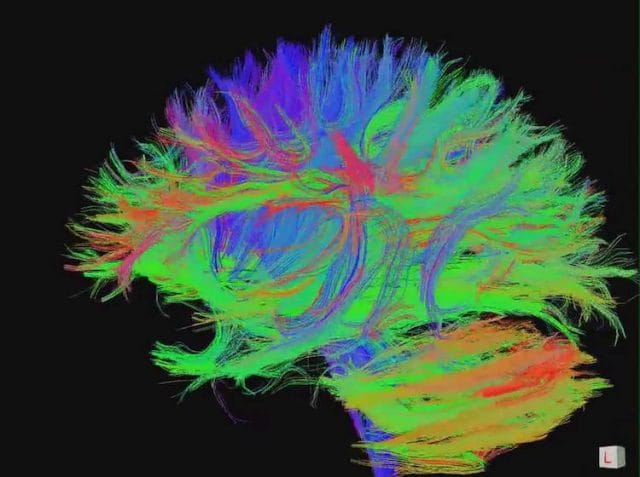
A partial connectome (jgmarcelinio)
The connectomes cellular neuroscientists study are elaborate and painstakingly constructed 3D maps of all the neurons in a brain. Unsurprisingly, the only organism to have its full connectome mapped in this way has a very, very small brain: the roundworm C. elegans.
But Poldrack specializes in human neuroscience, and in human neuroscience, connectomes are less precise. “The techniques we have right now can’t see the microscopic stuff in human brains, when they’re alive,” Poldrack explains. Instead, human neuroscientists use magnetic resonance imaging (MRI) to track blood flow to different parts of the brain. This gives them information on which parts of the brain are active, when. “When you do that,” Poldrack says, “you see very consistent patterns of which areas ‘move’ with which others.” From this, they deduce which regions of the brain must be connected.
Though the human connectome has been the subject of a lot of research, prior to Poldrack’s work, there had been little effort to track the change in any connectome over time. And that’s a problem, if we ever want to make sense of neuroimaging data. As Poldrack’s website for the project asserts, “People change. And when they do, their brains change too.”
But, Poldrack tells us, “Nobody that I know of has ever done more than a few MRI sessions with any one subject.”
In 2013, Robert Bilder, director of the Consortium for Neuropsychiatric Phenomics — a National Institute of Health-funded consortium, explained that Poldrack’s project might eliminate a blindspot in our understanding of the brain:
“Even in the cases where we’ve done the most scans of a single brain, we’re talking a few measurements separated by weeks, months or even years. As a result, we don’t even know what’s normal in terms of day-to-day variation. Russ’s project won’t tell us what’s normal, because it’s just one brain, but I think it’ll give us a sense of what’s possible. We’ll see the day-to-day fluctuation, see what kind of variability there is.”
Russome Poldrome
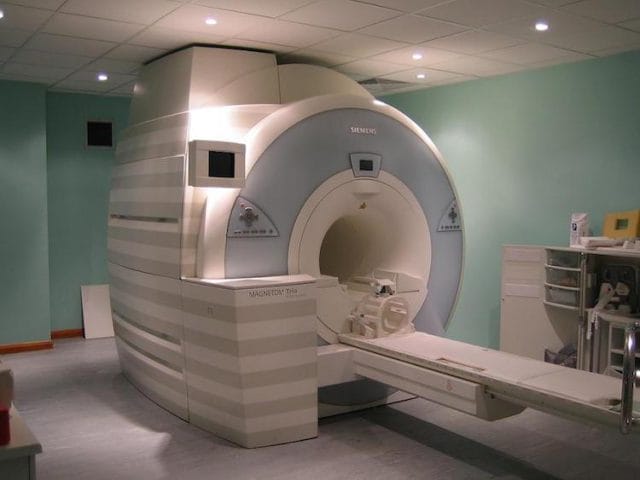
An MRI machine (Image Editor)
From the beginning, Poldrack knew he would run the experiment on himself. He was inspired by a long tradition of self-experimentalists in modern science. Self-study also had practical benefits — mainly, Poldrack could collect more data about himself than he could about anyone else.
There were a couple reasons for this. For one, conducting the study on himself meant Poldrack could get around IRB regulations against gathering gratuitous amounts of data. The IRB is an ethics committee that reviews, oversees, and regulates scientific studies of human subjects. By studying himself, Poldrack was able to collect information that would normally be considered invasive, a lot of which was for future exploration, not targeted around a narrow hypothesis.
“If we were doing this on a large volume of subjects, we would have to give a lot more justification for why we were doing what we were doing,” Poldrack explains. “This gave us a lot more freedom to try things we thought were going to be useful.”
Poldrack also knew that the amount of self-tracking he aspired towards would be daunting, and he was the most motivated subject on Earth. “I knew I was going to be more diligent than any other subject,” Poldrack says, “I’m going to try harder to show up to my appointments, and to track what I said I was going to track.”
He adds, “Actually doing the study gave me a lot of insight to how hard this was going to be for somebody who was not as invested as I am.”
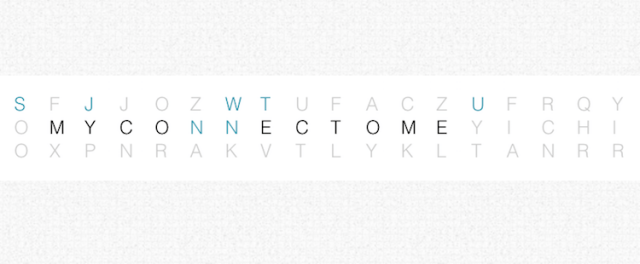
Poldrack named the project MyConnectome, partially so people would stop calling it the “Russome” and the “Poldrome.”

A map of the brain, broken down into “parcels” for analysis (Poldrack et. al.)
Data collection began in the fall of 2012. The metrics Poldrack tracked included: his mood, alertness, stress levels, diet, alcohol consumption, sleep, blood pressure, pulse, and the severity of his psoriasis, muscle soreness. He also kept a terse diary of each day’s events.
“A lot of this was based around what I already knew how to track, or things that I had a hunch would be useful,” Poldrack says. “At the same time, I was trying not to make it overwhelming. But I got so sick of doing it over time.”
He also made time twice a week to get his brain scanned in an MRI machine. That was rough, too. Most of the sessions were only 10 minutes long, but the machine noise alone wore on him. By the end of the study, he’d been scanned 104 times. And on Tuesdays, immediately after his scan, he’d get his blood tested. The analysis they ran included one that looks at the expression of genes within white blood cells, to track which genes were activated, day to day.
“We basically did everything we could afford to do,” Poldrack says. The study was funded using unrestricted funds from the University of Texas — he didn’t get any grant money for it. “There are things we still could do but haven’t done just because they’re expensive.”
Not being able to gather even more data might have been a blessing in disguise. In the spring of 2014, the mountain of data was finally all collected. And then he sat down to the long and hard task of making any kind of sense out of it. “When I went into the study, I hadn’t thought out how difficult the data analysis was going to be,” Poldrack laments.
A Proof of Concept

Maps of Poldrack’s connectome (Poldrack et. al.)
The paper, which was published in Nature Communications, enumerates the insights excavated from that mountain. The primary finding is that an individual’s neural networks do seem to change over time — day to day, week to week, month to month:
“Cognitive neuroscience studies have largely assumed that the measurement of brain function at a single time point is representative of the individual more generally. We have demonstrated the presence of rich temporal dynamics in brain function […] suggesting that the purview of studies of human brain function can usefully be widened to encompass the study of temporal variability within individuals.”
Poldrack stresses that, because it’s a single subject study, it should mostly be taken as a proof-of-concept. He thinks it will prove most useful as a starting point for future studies. Any particular correlation in Poldrack’s connectome might not generalize, but certain patterns of phenomena might bear out in more targeted research.
One such phenomenon the paper highlights is the significant link between the shape of Poldrack’s connectome and whether he had caffeine and breakfast.
“I didn’t initially plan on this as an experiment,” Poldrack says. “The main reason I fasted on Tuesdays is that I was getting blood drawn, and the main reason I didn’t fast on other days is that I like to eat breakfast and drink coffee. But over time it became clear that this had a significant effect on my psychological state, and was going to be an interesting thing to look at.”
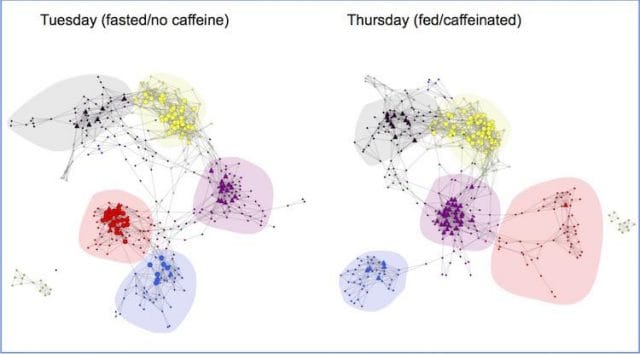
Poldrack’s brain on caffeine and no food. Poldrack’s brain on caffeine and food. (Poldrack et. al.)
Poldrack’s team found more connectivity in certain networks of the brain — particularly between systems associated with movement and vision — if he didn’t have breakfast and coffee. Poldrack says that’s surprising: “If anything we would have predicted that if you’re tired and caffeinated, connectivity would have gone down.” Figuring out why this effect occurred might be a fruitful avenue for research.
Another, more groundbreaking finding is that there were a “number of significant relationships” between gene expression and brain functional connectivity, linking the MRI data to Poldrack’s blood work. That’s exciting because it could be the key to understanding to how our neurological lives interacts with our genetics — how our connectome interacts with our genome. The relationships are so numerous and so prevalent that they constitute a significant discovery, even given the limitations of the single-subject study.
“I don’t think that anybody should look at the results and say, ‘Wow, this particular gene is related this particular brain system,’” Poldrack says. “But what it provides is kind of a proof of concept that if you look at brain connectivity and gene expression, there’s a bunch of relationships in there.”
“In neuroscience we don’t have any way of explaining those,” Poldrack adds. “Not all of them are false positives.” He plans on developing specialized software to explore this connection in the data.
The Open Human Connectome

A different side of Russell Poldrack. The outside.
Since the conclusion of his study, Poldrack has made the most of the freedom to lead a less rigid lifestyle. He’s stopped tracking every minute detail of his life, and he’s stopped devoting every Tuesday and Thursday morning to a biweekly MRI. Poldrack scheduled his interview with us on a Tuesday, immediately after an afternoon yoga class.
“In some ways, writing this paper was really exciting,” Poldrack says. “But it was also really demoralizing. I still don’t feel like the paper lives up to the hopes that I had for the project. It’s sort of the first time in my career that I’ve had that experience so strongly.”
Part of his disappointment has little to do with science. Poldrack thought that, in addition to the more scientifically significant findings, he might be able to derive personally useful insights from the data — for example, what kinds of foods exacerbate his psoriasis. As the subject of and scientist behind one of the most personally-focused studies in the history of science, that seemed like a reasonable expectation. But he’s had no such luck.
“The most interesting thing that came out of this was how little it changed my life to learn what we learned,” Poldrack said.
For quantified selfers, this is a lesson in the trade-offs of gathering loads of data, ignorant of a hypothesis. Poldrack designed the MyConnectome study to collect as much data as possible, to be explored later. He had a few scientific hypotheses going in, but he did not sufficiently tailor the data collection to any of his particular personal questions. So when it came time to try to answer them with the dataset, it wasn’t clear how to.
There’s still time. Poldrack says that though this paper has been published, there’s more analysis left to do on the data. He hopes that he will not be the only one to do it. He’s made almost all of the data — his weekly bloodwork, his diet, his mood, and pictures of his brain — public for people to play with. You can find it here.
“I had conversations with my colleagues about whether or not to make all this data public,” Poldrack says. “Particularly about the genetic information. In the end, I decided that the tradeoff was worth it.”
“Clearly there are risks. Somebody could take my genome and synthetically create my DNA and frame me for a crime,” he says. “But on the other hand, somebody could take my data and come back and say, ‘Hey we’ve figured out what’s driving your psoriasis! Change what you eat.’” Also, people might extend his scientific research: the more pairs of eyes on this dataset, the more likely they are to uncover insights. And artists, like Frick, might even make something beautiful or moving out of it.
Even so, he’s holding onto some data — the diary, for example, is not publicly available. And there are some kinds of data he considered too personal to record in the first place. “There’s so much of myself that I made public through this study,” Poldrack says, chuckling. “But I also wanted to be able to honestly say ‘No,’ when people asked me, ‘Did you track when you had sex?’”
As for the data he is sharing, Poldrack points out that as a tenured professor, he’s in a pretty privileged position. He says he doesn’t need to worry about an artifact he didn’t know about in his data compromising his job security, or his health insurance.
“If anybody can take the chance of being public with this kind of information, I can,” he says. “Hopefully good things will come of it, and my example will inspire others to do the same.”
If others follow in Poldrack’s example and map their connectome, it will put his data in much needed context. Though Poldrack’s connectome did exhibit change over time, he has said he’s a pretty “even keeled person,” and thinks that someone who experiences wider emotional variation might have a more variable connectome.
In the meantime, Poldrack says he’s thinking about getting back into tracking, “to get a handle on certain health things.” He’s talking mostly about nutrition. Poldrack says he now understands what he would actually have to track, and how, to figure out if and how diet affects his psoriasis. But after so much data collection, the ultimate quantified self scientist says it will take him some time to summon the necessary willpower. As he puts it, “I need to buckle-down and decide if I’m going to make myself track these things.”
***
Our next post is about how a beer brewer at Guinness revolutionized modern statistics. To get notified when we post it → join our email list.
This post was written by Rosie Cima. You can follow her on Twitter here.