


Priceonomics; data via American Community Survey 2013
Last week we published a series of charts showing which racial and ethnic groups were best represented in which major American cities. But while some cities were overwhelmingly Hispanic, black or white, other cities seemed exceptionally demographically balanced — and there had to be a way to quantify and highlight that diversity.

Economists use the above equation to calculate the diversity of a market. s-i represents company-i’s marketshare, and the overall equation squares them, and sums them up for each company in a market. The more companies present in a market (N), and the more balanced their shares are, the lower the sum (H).
The FTC uses this sum, known as the Herfindahl-Hirschman Index (HHI), as “screening tool” to determine whether a merger/acquisition will substantially lessen a market’s competitiveness, or, worse, threatens monopoly. In the case of a monopoly, HHI = 1. The lowest HHI can be is 1/N, where N is the number of companies in a market.
But the index works as a general-purpose measure of diversity, too. Ecologists the same calculation to gauge the diversity of an ecosystem. In the context of ecology, the metric is called the Simpson diversity index. One hundred red fish and two hundred blue fish makes for a Simpson diversity index of (1/3)^2+(2/3)^2, or 0.556 for the overall pond.
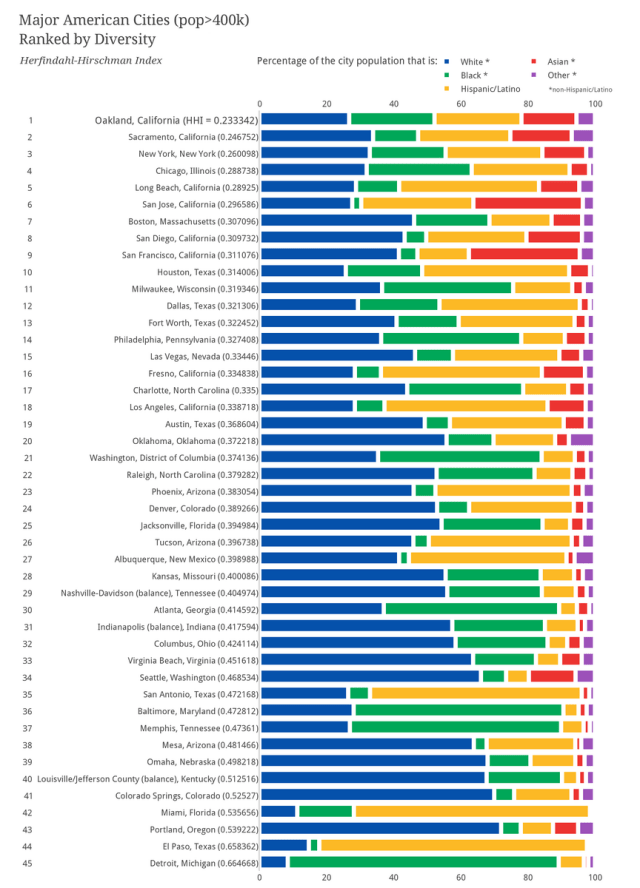
To make the chart above we calculated each city’s HHI. We treated our major ethnic and racial groups like “companies”, and each group’s “market share” was the percentage they comprised of the city’s population.
We looked at five groups — white people, black people, Hispanics/Latinos, Asians, and a miscellaneous category including people of mixed race, Native Americans, and Pacific Islanders — giving us a lower bound of 0.200.
At the top of the chart, Oakland, California is the most diverse city in America, with an HHI of 0.232.
The two cities at the very bottom of the chart have national minorities in the majority: El Paso, Texas is the most Hispanic/Latino major city in America, and also its second-least diverse, with an HHI of 0.658. Detroit, Michigan is the least diverse, with an HHI of 0.665, and is the major American city with the highest proportion of African Americans (80.7%).
We just published our latest book → Hipster Business Models!
This post was written by Rosie Cima; you can follow her on Twitter here. To get occasional notifications when we write blog posts, please sign up for our email list