


This post is adapted from the blog of PsyDPrograms.org, a Priceonomics Data Studio customer. Does your company have interesting data? Become a Priceonomics customer.
***
Medical outcomes and the quality of healthcare are incredibly difficult to measure in America.
Patients often see many different doctors and hospitals and each of them administering small parts of the patient care. Getting the data from these disparate providers and assessing their relation to patient outcomes is next to impossible. Not only that, but how do you measure patient outcomes exactly? If a patient dies, is it because they got bad care or because they were extremely sick.
Amidst this chaos, there is one data source attempting to rate the quality of healthcare, particularly in hospitals — Medicare. Medicare, for those who are not familiar, is the federally funded insurance organization for senior citizens. Because virtually all spending and treatment for this population flows through Medicare, it’s in a unique position to measure hospital quality.
Starting April 2015, the Centers for Medicare & Medicaid Services (CMS.gov) started releasing hospital quality rankings. This data was most recently updated in January 2020. The Centers for Medicare & Medicaid Services, CMS.gov, is part of the Department of Health and Human Services (HHS.gov).
Along with Priceonomics customer PsyDPrograms.org, we decided to analyze this Medicare hospital quality data to see the states and cities with the best (and worst) hospitals in America. On the state level, Wisconsin, South Dakota and Utah have the best hospitals on average while Washington DC, New York, and Nevada have the worst-rated ones. Among the major cities we looked at Cincinnati, Austin and Indianapolis ranked as having the best hospitals, while Las Vegas, Brooklyn, and Washington DC ranked as having the worst.
***
Before diving into the data, it’s worth spending a moment on the methodology.
For this analysis we looked at the CMS “Overall Hospital Quality Star Ranking” made most recently available in January 2020. In this data set, 3,698 hospitals were scored on a rating from 1 to 5 stars, with 5 stars being the best.
The CMS outlines their methodology for creating and the scoring hospitals here, which includes 57 different measures in categories such as patient experience, mortality, and safety of care. While this data is for Medicare and Medicaid patients, these hospitals tend to service patients of all age groups and income levels.
To begin, let’s look at which states have the highest rated hospitals on average according to the CMS. We group all hospitals by state and then calculate the average among hospitals that were given a star rating by the CMS. Below are all 50 states plus Washington, DC, ranked from states with the highest score to the lowest:
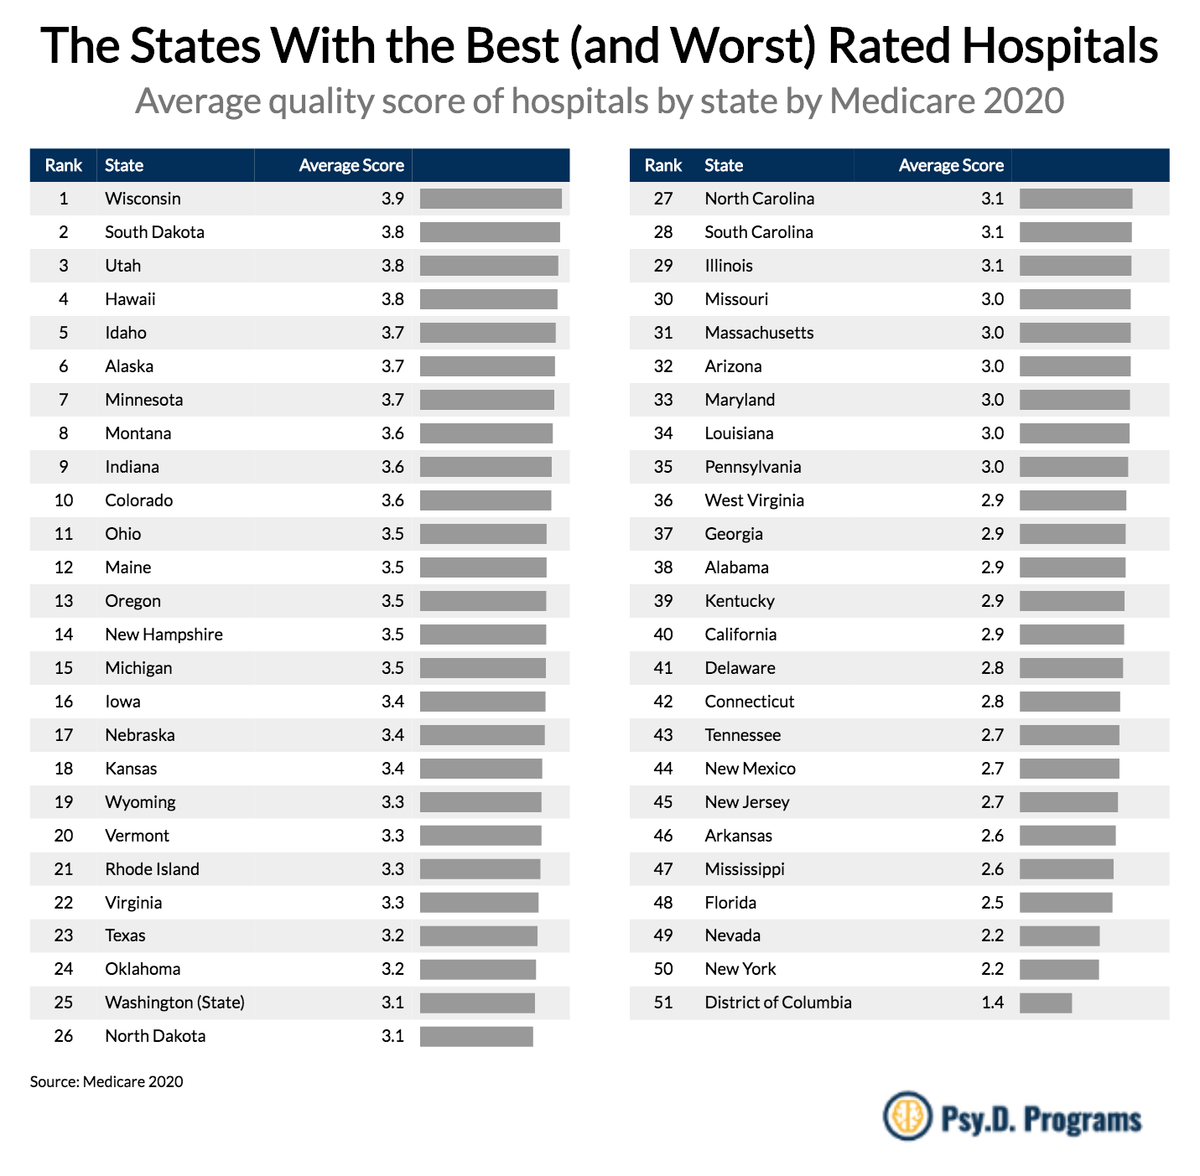
Wisconsin hospitals rank as the top in the country, with a 3.9 average quality score. Part of the reason for the state’s success is that it has a high number of Mayo Clinic hospitals in the state, all of which got over 5 stars. In South Dakota the Avera hospital network has five hospitals attaining the 5 star ranking.
Washington DC ranks as the area with the worst rated hospitals with a 1.4 star rating on average. While better rated hospitals are available in nearby Maryland and Virginia, DC hospitals have been criticized for failing at patient safety and maternal health. New York has the second worst CMS hospital ratings, despite spending more than any other state on healthcare.
Next, let’s extend this analysis to determine which cities have the best and worst rated hospitals according to the CMS. The chart below shows the average star quality in cities with at least 7 rated hospitals. Cities are ranked from highest average score to lowest:
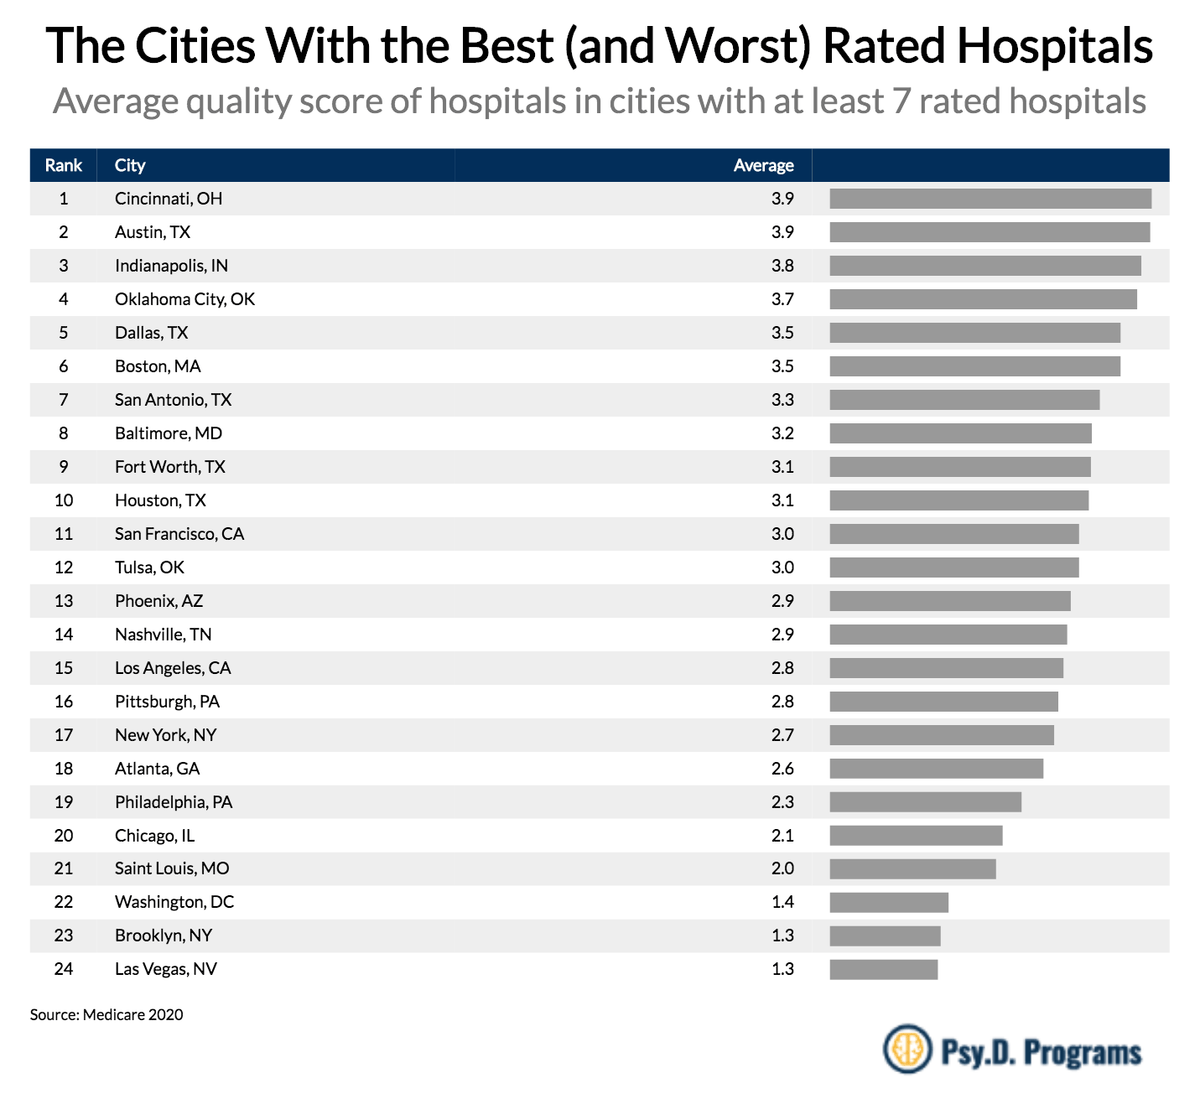
Cincinnati ranks as the city with the highest rated hospitals in the United States, just beating out Austin and Indianapolis. Each of the top cities have mostly 5 and 4 star hospitals. On the other end of the spectrum, Las Vegas ranks as the the city with the worst rated hospitals in the country. Nearly every hospital in Las Vegas attains a 1-star rating, the lowest score given by the CMS. Part of this low score can be attributed to a shortage of doctors in the state of Nevada.
Lastly, is there any difference in quality score based on who owns the hospital? Do non-profits provide better quality of care over for-profits? Or are government organizations more effective? The chart below shows the average rating by ownership type:
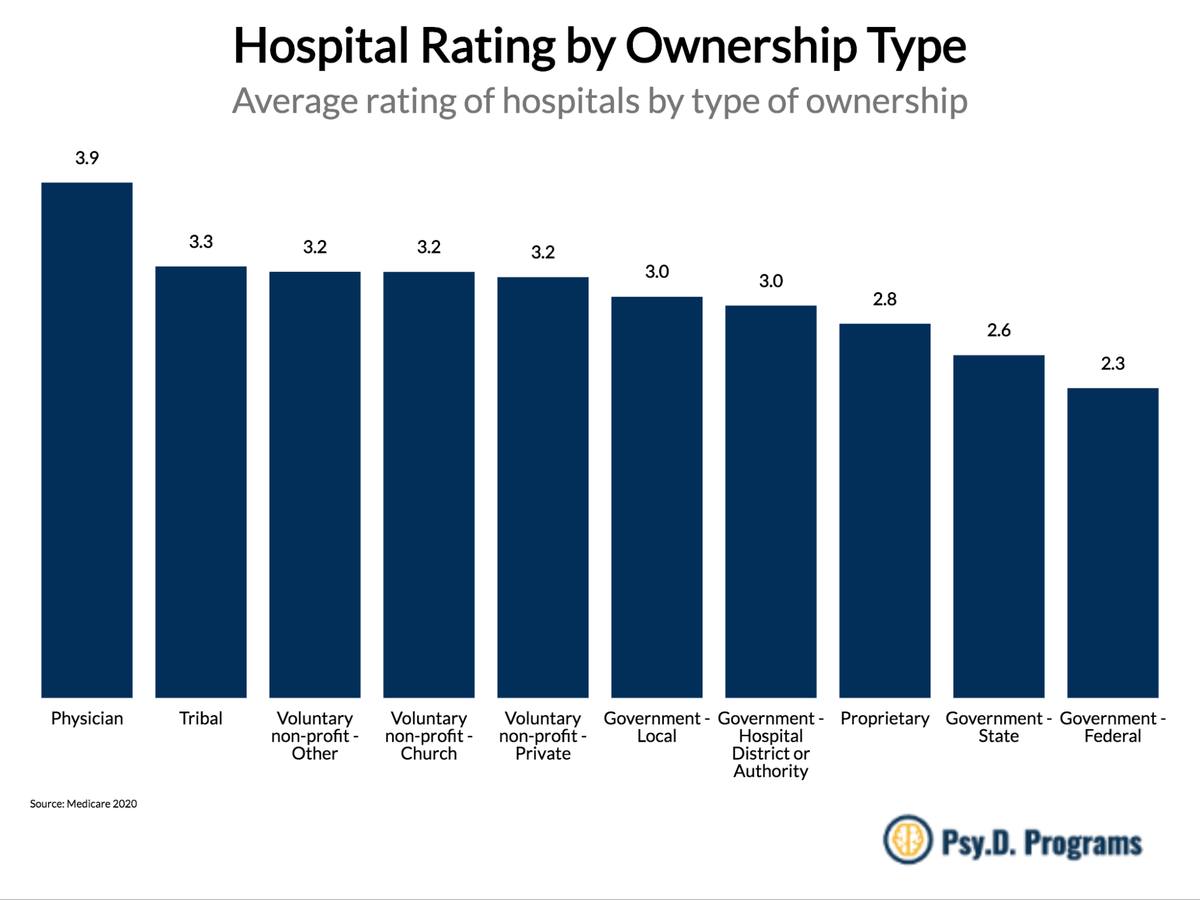
By a considerable margin, physician-owned properties have the highest rating with a 3.9 average quality score. While there were only 34 of these types of properties rated by the CMS (approximately 1% of rated hospitals), it may be worth exploring if physician-owned hospitals have the promise to deliver better healthcare. State and Federal hospitals rank last when it comes to quality, just beating out proprietary (private hospitals).
***
The CMS hospital data reveals there are huge disparities in the quality of care across America. For example, if you live in Las Vegas, almost every single hospital available is rated one-star. Other places like Cincinnati or Austin are virtually all four or five-star hospitals. While measuring health care quality is a challenging effort, the CMS data is a great starting point for finding out which hospitals are offering quality care and which ones are not. As the old adage goes, you can’t improve what you don’t measure.
***
Note: If you’re a company that wants to work with Priceonomics to turn your data into great stories, learn more about the Priceonomics Data Studio.