


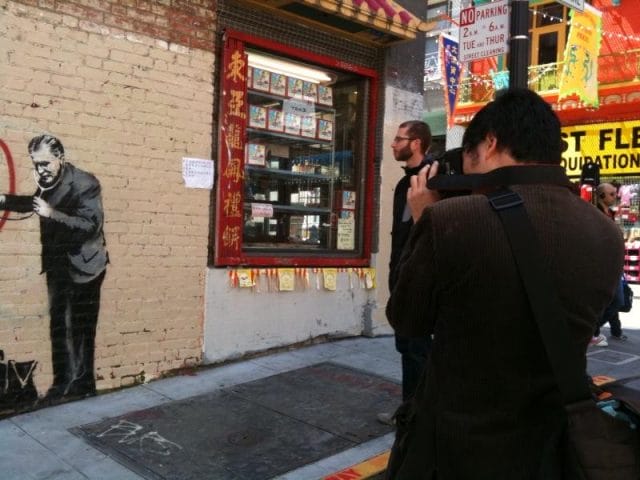
Photo source: Stephen Woods
The city of San Francisco spends over $20 million every year on graffiti removal. That’s a bummer in terms of wasted resources, but it does have an upside. Since the city also keeps a record of every incidence of graffiti in the city by neighborhood, we can see which San Francisco neighborhoods are the most besmirched! (Or coolest, depending on your perspective.) The 2013 data reveals that the Mission is king:

Total Graffiti Cases Opened in 2013, by Neighborhood. Data via SFGov and City Data SF
The Mission accounts for almost 21% of San Francisco’s graffiti cases. The neighborhood, however, is the 2nd most populous (43,197 residents) in San Francisco, behind the Outer Sunset (74,219). So, its high ranking may merely represent its large size.
Looking at the number of graffiti incidents per 100 residents reveals a different picture:
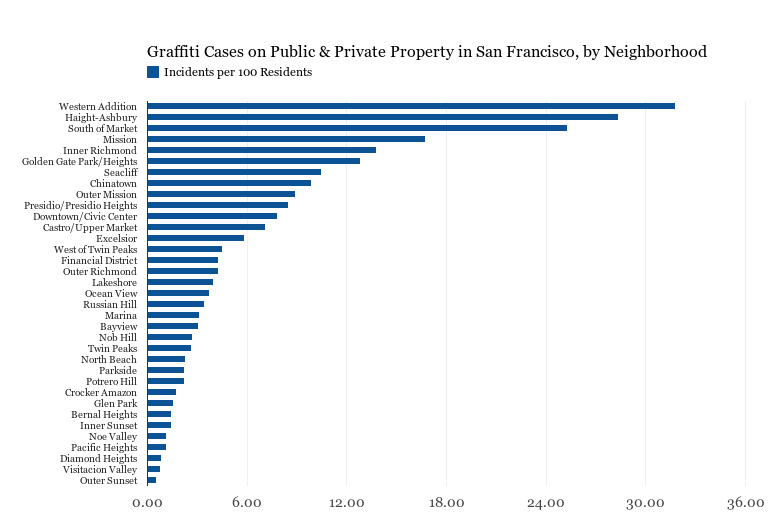
Graffiti Cases Opened in 2013, per 100 Residents. Data via SFGov and City Data SF
Adjusting for the number of residents in the neighborhood puts the Mission a distant fourth. Another way to look at the amount of graffiti by size is by literal square mileage, which we do below:

Graffiti Cases Opened in 2013, per Square Mile. Data via SFGov and City Data SF
When we calculate graffiti density (graffiti incidents per square mile), this new narrative holds true; Western Addition and Haight-Ashbury are the clear front-runners, while Chinatown, the Mission, and SOMA round out the top five. So, while there is plenty of graffiti in the Mission, Western Addition and Haight-Ashbury might actually be more densely packed with it.
Of course, the Priceonomics office is located in the Mission, so we might just be mining the data to confirm our bias that we’re located in a nice place. Unless being located in the middle of all that graffiti would make us hipster and cool.
To get occasional notifications when we write blog posts, sign up for our email list.