


This post is adapted from the blog of SketchDeck, a Priceonomics customer.
Your company has a project they you want to complete, and your boss wants to give you a deadline for it. When coming up with a timeline for the project, your boss might break it down into steps you’ve done before, figure out how long, on average, those steps take to complete, and then add them up to get your overall project timeline.
However, your boss may be setting you up for failure.
While this is a completely common-sense way to estimate a timeline for a multi-step project, it would be a terrible method to adopt if you consider the basic statistics of interdependent processes. It’s part of the reason why so many projects don’t make their deadlines; the deadline was unrealistic.
The dataset of SketchDeck projects contains 70,000 hours of projects through our on-demand service. When we first started, we found that setting simplistic timelines – adding up median completion times for each step in your project – consistently underestimated how long projects would take. In fact, creating a timeline based on median completion times underestimates the actual project timeline 67% of the time.
A misunderstanding of statistics might be a huge part of why projects are alway late at your company.
What we learned from delivering 70,000+ hours of design
Design projects in our marketplace are often multi-step processes. Projects (things like designing a logo, presentation, website, etc) are are completed in steps: a designer might make a sample first, then a first draft of the design, then a final draft. The designer and the client go back and forth on the design of each step, not moving onto the next step until the client is completely happy with the design. Sometimes this takes a long time. A client could take a very long time, days to months, to sign off on a step. Your company’s process might work a lot like this.
However, unlike most companies, we measure exactly how long each of these steps – “sample”, “full draft,” “final proof” – takes to complete, on average. From this we could estimate project timelines by simply adding up these median times for each kind of step.
But if we did that, we would chronically underestimate how long our projects would take.
To demonstrate this, we analyzed tens of thousands of client/designer interactions. For each project, we calculated how long this seemingly sensible “medians-based” estimation method would predict they would take. And then we looked at how long they actually took.
For multi-step projects, this method underestimates project timelines – a project’s start to end date – by an average of 67 hours. If you look at projects with 3 steps or more, the number jumps to 81 hours. And 67% of projects finish after their medians-based estimate.
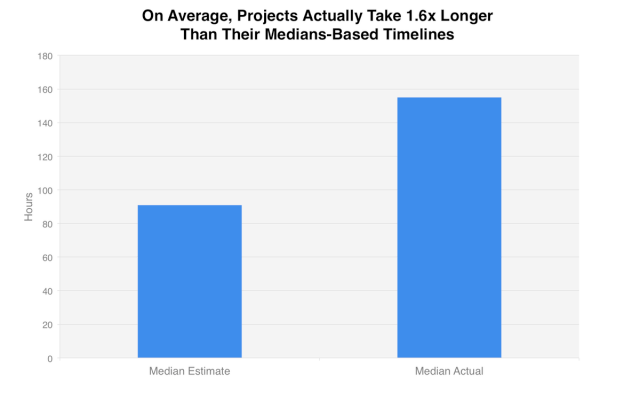
If we estimate timelines by adding up the median completion times for all the steps in a project, the average estimate for projects with 2 or more steps is about 91 hours. The average actual completion time for a multi-step SketchDeck project is 155 hours.
What’s going on here?
People underestimate timelines all the time. Studies have shown that students deliberately and systematically underestimate how long it will take them to complete assignments and academic projects, and that people regularly mail in their tax forms a week later than they expect to.
Plenty of quirks of human psychology contribute to this phenomenon. The famous psychologist Daniel Kahneman dubbed the phenomenon a species of his “planning fallacy.” Kahneman hypothesized that planners tend to neglect their full experience of how much time similar tasks require, and focus on an idealized projection of how the task might go.

Daniel Kahneman (Eirik Solheim)
“People who have information about an individual case,” Kahneman has observed, “rarely feel the need to know the statistics of the class to which the case belongs.”
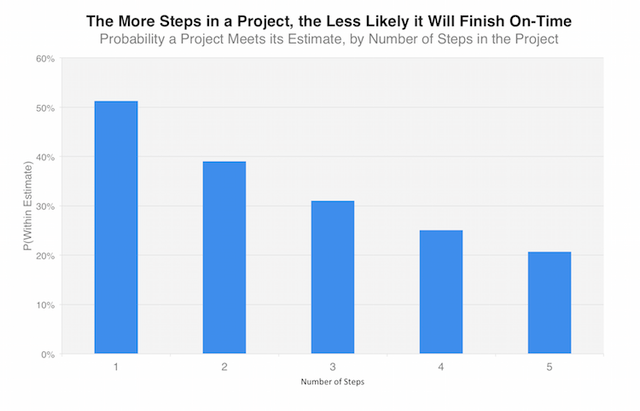
For every step in a project, there’s about a 50% chance of completion under or on the median step completion time. And there’s about a 50% chance of not. If a project is composed of 2 steps, the probability that both steps are at or under their median times is 50% * 50%, or 25%. For a 3 step project, it’s 50% * 50% * 50%, or 12.5% and so on. If a project has 6 steps, the chances of some of those steps going over its median is greater than 98%.
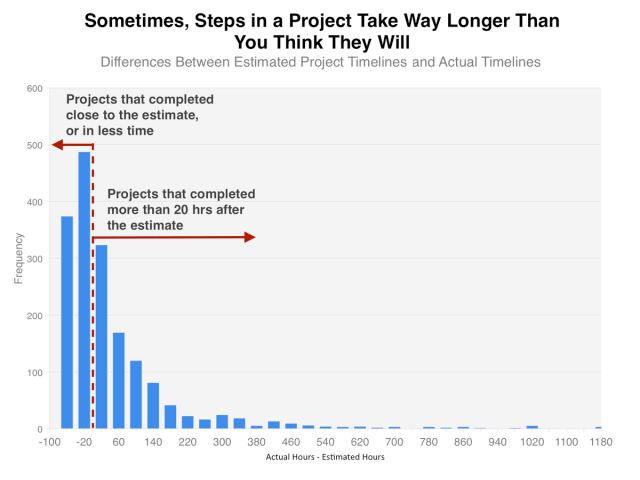
As humans, we are always hopeful that the steps that finish below the median time will “make up” for the steps that go over. But while there’s a lower bound to how “under” the median a step can be – a step can’t take negative time – there’s virtually no upper limit to how much over the median time a project can take. It’s important to note that, in our data, these completion times are extra volatile because completing a step requires coordination between the designer and the client. Because clients will sometimes table a project for a while, or change their mind about the direction of a design halfway through the process, or just take their time getting back to the designer, some projects can stretch out a really, really long time. (And we mean long — our longest “step” took more than 3,800 hours for the client to reply!)
This gives us a distribution with an upper tail that is longer than its lower tail: 25% of steps are 35 hours or more under the median time to complete a step of that kind. But 34% of steps are 35 hours or more over the median. And a 25% of steps take over 72 hours over the estimate.
With a distribution like this, each subsequent step increases the probability that a project will finish over the medians-based estimate. We can also use this distribution to determine the actual probability that a whole project finishes over its medians-based estimate.
More than half of the projects in our dataset took either 2 or 3 steps to complete. If we randomly sample our distribution of step completion times, there’s a 51% chance any 1-step process will complete at or under the median estimated completion time, i.e. that the project will be “on time” using the standard naïve estimation approach. That number falls when steps are added: There’s a 39% chance any 2-step process will be on time. There’s a 31% chance that any 3 step process will.
The solution to accurately estimating project timelines
In investigating and tackling this issue, we’ve found a set of complementary solutions. These can be used for any sort of project management, from graphic design to rocket ship building.
1. Calculate project timeline based on the distributions of every step
Your overall project completion time is actually a distribution, created by combining the distributions of every step completion time in the project. Once you have an accurate distribution of overall project completion, you know the median time and how likely it is to take longer. Learn more about summing random variables.
This is of course only an option if you have access to good data on how long things take. If you don’t – maybe because your team hasn’t been keeping metrics on project completion, or maybe because you are attempting a project with steps that are completely novel to you – then you should keep in mind how volatile these steps can be, and how likely they are to stretch beyond your estimates.
2. Improve the completion time distribution of all steps
Now we know the overall project completion time is very sensitive to each step’s completion time distribution.
There are two things you can target here: make the step complete faster (have a lower median completion time), and make the step more reliable (a narrower variance in stats speak).
Here are some things you can do to improve both:
- Streamline internal process (e.g. have internal small edits get done by whoever proposed them rather than waiting on a second person)
- Have short internal deadlines to keep a big buffer zone before the client deadline
- Schedule everything by timezone to remove long delays between collaborators
- Improve client notifications to help them respond faster
3. Selectively improve completion time distribution of steps when project is behind
Since the overall project timeline is the combination of every step, significantly improving the distribution of a few steps’ completions will improve the project timeline. While long tailed step completion distributions mean projects won’t naturally “make up” time, accelerating a couple of steps definitely will make up time.
Thanks to the magic of data, we can monitor all of our projects in fine detail. We flag when they’re getting behind our timeline, and get our project management team to give some extra help.
We’ve found that focusing an extra hour of dedicated project management time on a project can roughly reduce median completion time by 88%, and reduce the 95% percentile delivery time by 92%.
May your deadlines be accurate
Unrealistic deadlines don’t help anybody, and this is a situation in which a little knowledge can be a dangerous thing. So, if you do have the data, be careful to use it right. When it comes to timelines, 2+2 does not necessarily equal 4. That is, a step that usually takes 2 hours, and another step that usually takes 2 hours, probably won’t take 4 hours overall. If you assume they will, you’re going to end up with as overly “optimistic” a timeline as someone with no data at all.
***
Our next post is how the KKK perpetrated a financial scam on its members. To get notified when we post → join our email list.