


In 1950, when Mildred Jeter met Richard Loving, marrying a person of a different race was illegal in 29 states. According to Census data, while 90.4% of the married people in America were White and 7.6% were Black, marital unions of Blacks and Whites made up only 0.1% of all marriages.
Jeter, a Black and Native American woman, and Loving, a White man, fell in love and decided to get married. They lived in Virginia, one of the states that still banned “miscegenation” – the derogatory term used to describe interracial coupling – so they needed to travel to the District of Columbia to be officially recognized as a couple. They were married in 1958.
Five weeks after the couple married and returned to Virginia, the county sheriff and two deputies broke into Jeter and Loving’s bedroom to arrest them. They were charged with violating Virginia’s Racial Integrity Act, which outlawed interracial marriage in order to protect “Whiteness.” Although the couple initially pled guilty, they later decided to dispute the law, and took their fight all the way to the Supreme Court. In 1967, the Supreme Court ruled unanimously on the side of the couple. The Loving v. Virginia verdict made interracial marriage bans illegal across the country.
The United States has come a long way since then. In 2010, 1.8% of all new marriages were between Blacks and Whites, nearly twenty times higher than in 1950. And more than 15% were “intermarriages” – marriages between people who don’t identify as the same racial or ethnic group, up from 6.7% in 1980.
Professed attitudes about interracial marriage have also changed dramatically. In 1987, Pew Research polled Americans on whether they believed it was acceptable for Blacks and Whites to date each other. At that time, less than 50% of Americans thought interracial dating was acceptable. By 2010, that number was well over 80%.
The progressive views of young Americans suggest that the country is likely to become even more open-minded about intermarriage. In 2014, 85% of Americans between the age of 18 and 29 responded that they would accept a family member marrying a person of a different race or ethnicity, compared to just 38% of those 65 or over.
The raw numbers show that over the last several decades, the number of intermarriages among young couples has nearly tripled. But how much progress has really been made?
Our examination of the data suggests that the increasing rate of intermarriage may be driven by demographic changes more than changing attitudes. Today, there are proportionately more Asians, Hispanics and people of other racial/ethnic backgrounds in the United States than ever. These racial/ethnic groups have always been unusually likely to intermarry. There are also fewer White people – the group that has always been least likely to intermarry.
Once these demographic changes are accounted for, a large portion of the increase in intermarriage rates vanishes. More accepting professed beliefs do not seem to be the main cause of the rise in the number interracial couples.
***
Prior to 1980, the Census did not collect data on intermarriage. The available data from that period only allows us to examine interracial marriage, which does not include marriages between Hispanics and other racial/ethnic groups. (Hispanic is considered an ethnic category, not a racial one.)
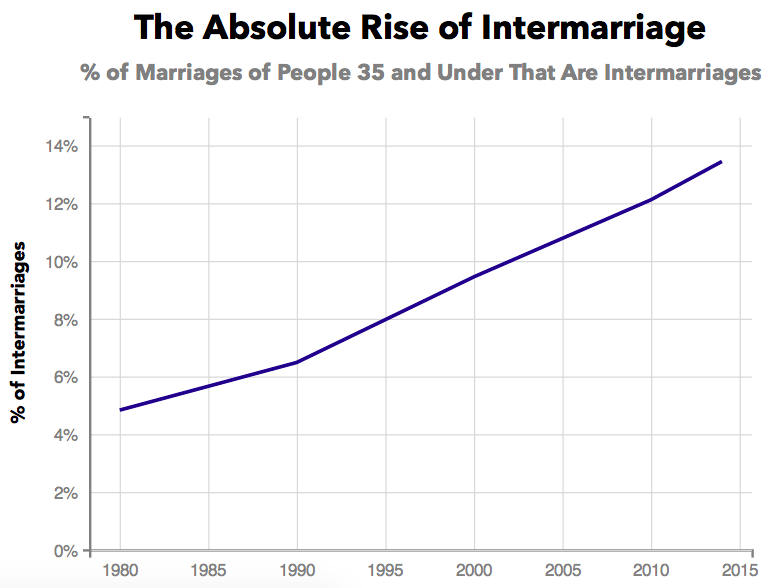
For the remainder of this article, we will only examine intermarriage, so our analysis begins in 1980. We chose to analyze intermarriage because this is the metric typically discussed by researchers and the media. The following chart displays the intermarriage rate over time for couples where both members are 35 or under.
Data: Census
Rates of intermarriage have seen a positive, almost linear increase since 1980. While only 4.8% of marriages of Americans 35 and under were intermarriages in 1980, this increased to 13.4% in 2014.
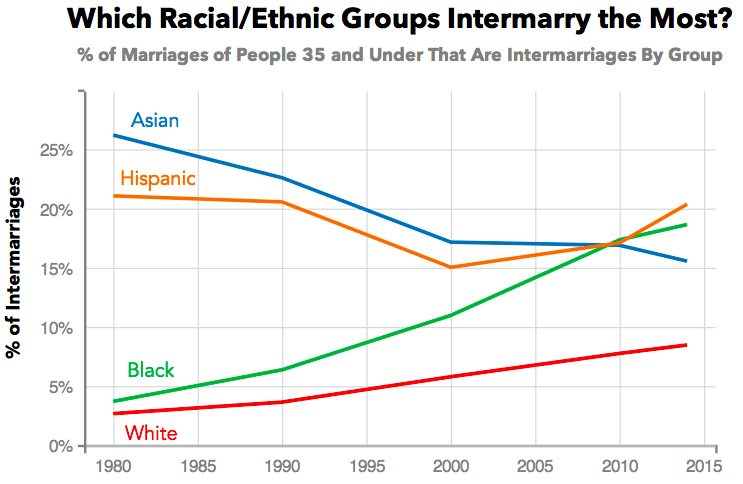
Yet the rates of intermarriage among different racial/ethnic groups show very different trends. This next chart displays intermarriage rates across time for the America’s four major racial/ethnic groups for the same period.
Data: Census
The most dramatic change over the last several decades is the number of Blacks intermarrying. In 1980, less than 4% of all married Black people under the age of 35 were not married to other black people. Today the rate is 18.7%.
But Black people only made up between six to seven percent of the total under 35 married population during this period. So while this is a substantial increase, it accounts for less than 1% of the overall increase in interracial marriages.
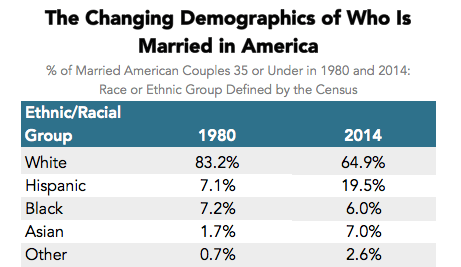
The percentage of intermarried Whites more than tripled from 2.7% in 1980 to 8.5% 2014. Though this rate of growth is not as high as that of the Black population, it is a larger component of the general rise in intermarriage. This is because Whites make up the majority of married people – though their share is decreasing. White people made up 83% of the married population in 1980 and 65% in 2014, meaning that the nearly 5% increase in the intermarriage rates of Whites accounts for a little over 4% of the overall increase in intermarriages.
As the chart shows, Hispanics and Asians are significantly more likely to intermarry than White people. But they are actually slightly less likely to be intermarried today than in 1980.
So if Black and White marriage patterns account for roughly 5% of the overall 8.4.% increase in intermarriage rates, what accounts for the remaining 3.4%? Demographic shifts.
Data: Census
Hispanics, Asians, and people who the Census classifies as being of “Other” racial/ethnic backgrounds only made up about 10% of the population in 1980, but today they make up about 29%. The nearly 20% increase of populations that were already intermarrying at higher rates explains a large portion of the rise in intermarriage.
But demographic changes likely account for more than this 3.5% increase. It’s not just that the United State’s increasing diversity means there are more Asians, Hispanics, and Other individuals who choose to intermarry. Diversity also creates more opportunities for intermarriage for all Americans.
Almost surely, some of the Whites who were not intermarried in 1980 would have been more likely to marry a person from different race or ethnicity had the population been more diverse. If you grow up in a town with only one non-White family, the intermarriage rate doesn’t really reflect your beliefs. That’s partially why White people were three times less likely to intermarry in 1980 than in 2014: there were half as many opportunities. Only about 17% of young married people were not White in 1980, compared to 35% today.
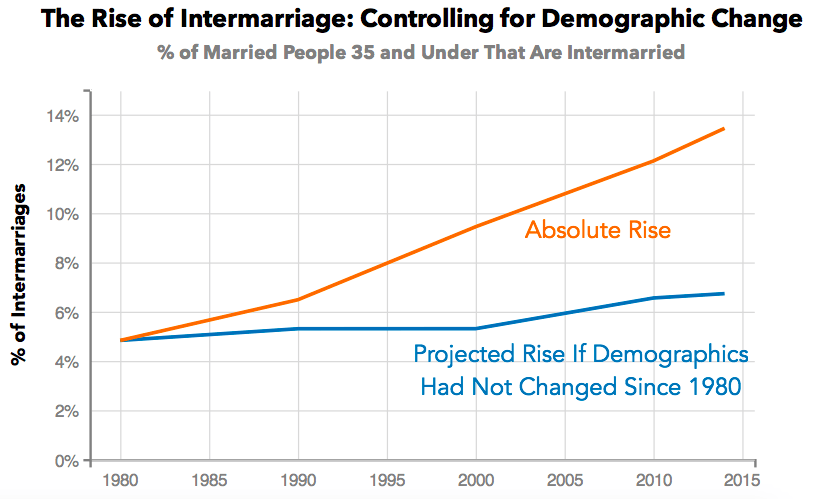
So what would America’s intermarriage rate look like if the country had not become more diverse? In the chart below, the blue trend line is our estimate of the rate of intermarriage if the demographics of the young married population had not changed since 1980 – the orange line shows the actual increase. While there is still an increase, it is not even close to what we saw in the first chart.
Data: Census
Our “no-demographic change” estimate suggests that intermarriage would have only risen to 6.7% if demographics had not changed – a 1.9% increase, dramatically smaller than the 8.6% increase actually observed.
In other words, changing beliefs is responsible for only a fraction of the increasing intermarriage rate.
We arrived at this conclusion—and created the above chart—by calculating how much closer Americans have come to marrying without regard to race.
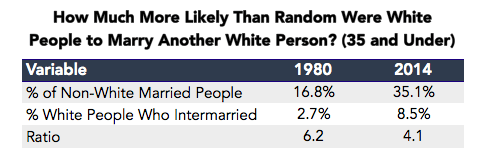
For example, in 1980, 17% of the young married population was not White. If White people were marrying without regard for race, we’d expect 17% of them to intermarry. In actuality, though, only 2.7% of White people intermarried. Thus, White people were roughly six times more likely than random to marry another White person.
By 2014, however, Whites were only four times more likely than random to marry another White person. (Thirty-five percent of the young married population was not White, and White people intermarried 8.5% of the time.)
To get our approximation of what intermarriage rates would have without demographic change, we simulated the intermarriage rate holding the proportion of Americans from each group constant through time. The only variable we allowed to change was how much less likely each group was to intermarry than if it was random. The estimate does not take into account factors like local geography, but it still gives a good sense of how much the rise in intermarriage is due to changing demographics.
***
Another way to see the strong relationship between racial/ethnic diversity and intermarriage is by looking at the states with the highest rates of intermarriage.
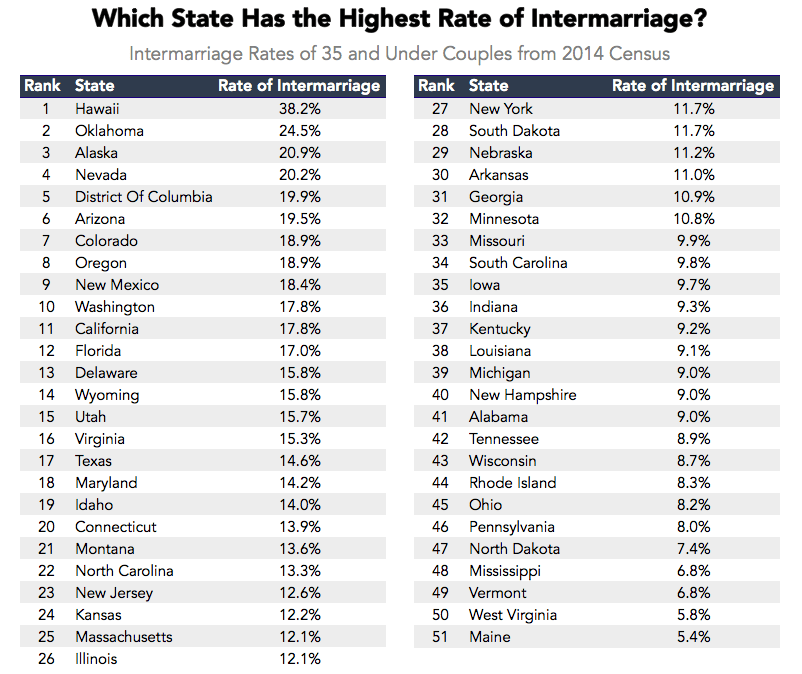
Data: Census
Hawaii is America’s most diverse state; no racial/ethnic group makes up more than 40% of the young married population. It is also number one in terms of intermarriage. Young married people in Hawaii are seven times more likely to be intermarried than in Maine, where about 95% of the young married population is White.
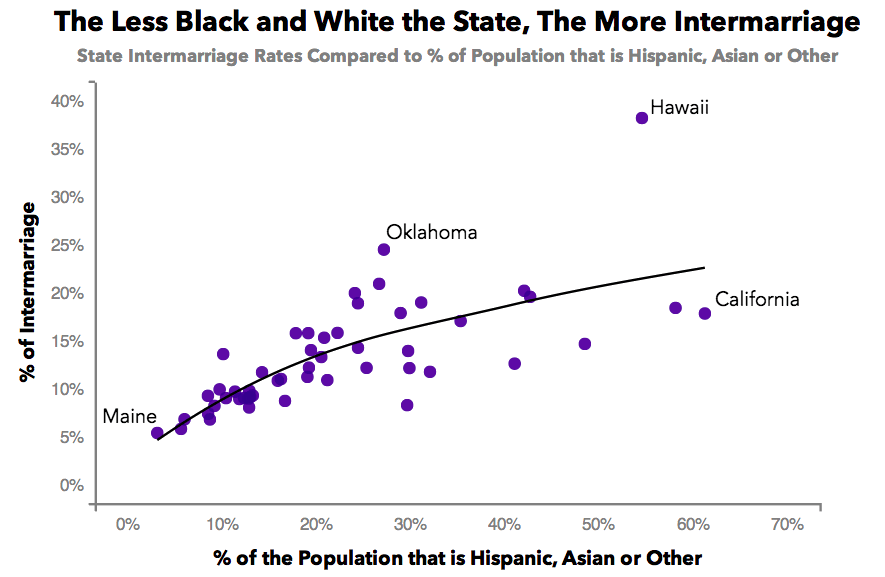
States’ intermarriage rates are highly correlated to the proportion of its population that is neither White nor Black. Whites are particularly likely to intermarry with Asians and Hispanics, and thus places where there are large Asian and Hispanic populations tend to have higher intermarriage rates.
The scatter plot shows the relationship between the percentage of the population that is Hispanic, Asian or Other, and the proportion of the population that is intermarried.
Data: Census
***
Since Loving v. Virginia, millions of couples have availed themselves of what Chief Justice Earl Warren called their “fundamental freedom” to marry a person of any race or ethnic background. The rate of couples intermarrying in the United States continues to rise.
Yet this rise is not necessarily a result of a change in attitudes about marrying across racial/ethnic lines. Much of it is just math. There are now more Asians, Hispanics, and people of Other racial/ethnic backgrounds, and those groups have long been most likely to intermarry.
Progress has been made, but significantly less than the raw numbers would make you think.
Our next article investigates why the most impressive archaeological site in America has a highway running through it. To get notified when we post it → join our email list.
![]()
Note: Check out Priceonomics Content Marketing. We have some free software you can use to measure content marketing performance.