


Photo credit: Jonel Hanopol
“The life of man [is] poor, nasty, brutish, and short,” Thomas Hobbes wrote in The Leviathan in the 17th-century. The statement reflects the man’s philosophy, but also the fact that life expectancy was an estimated 39 years at the time.
Four centuries later, much of the developed world boasts life expectancies north of 70 years. Some studies point to changes in diet as possible determinants of how long one can live. Various experiments seek to slow down the aging process, and a recent cover of TIME asked “Can Google Solve Death?” Our life spans increased 30 years over the past 400. It seems that we have steadily pushed death back farther and farther, and some dream of eliminating it altogether.
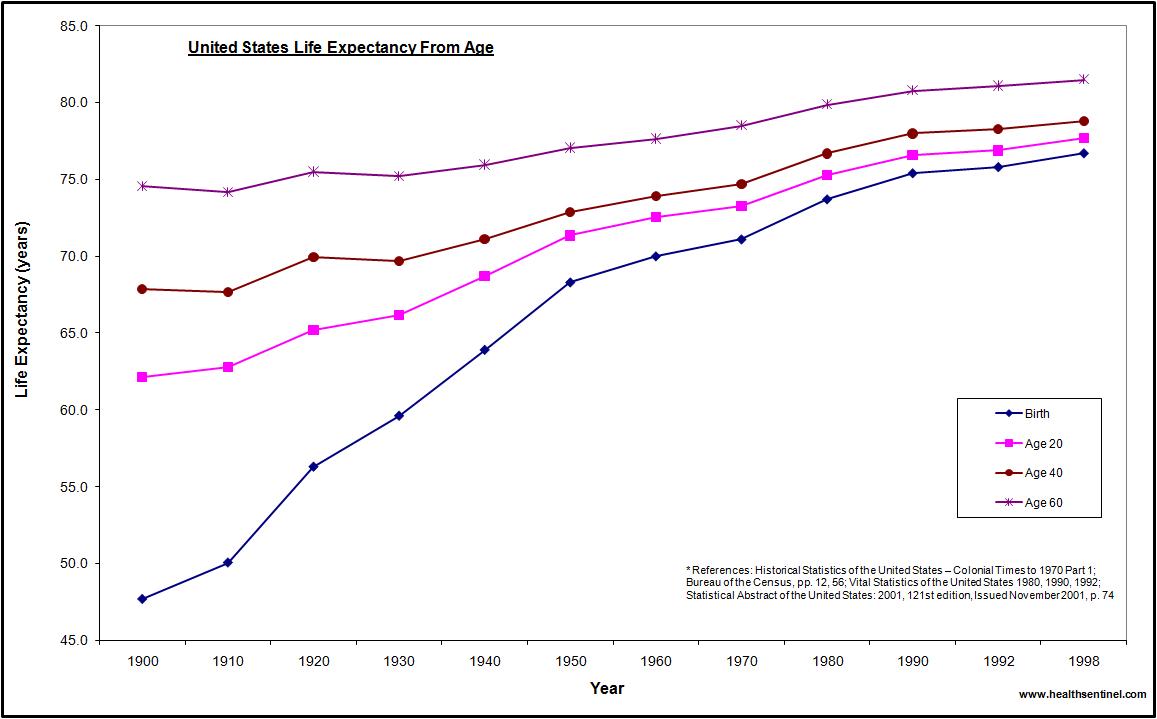
Life Expectancy by Age in the United States from 1900 to 1998. Source: Health Sentinel
When this author thought of life expectancies, he imagined the average person living to that age before passing away. But averages can hide variation, and in this case, averages are hiding the fact that higher life expectancy is as much about lower mortality rates among infants as achieving the ability to live longer.
The graph above illustrates this point. When we refer to life expectancy, we usually mean “life expectancy from birth.” From 1900 to 1998, life expectancy from birth for Americans rose from 47 to 75, an increase of 28 years. But life expectancy is also measured as the number of years remaining in someone’s life (or expected age of death) given one’s current age. In 1900, life expectancy for someone who made it to her 20th birthday was about 63. In 1998, this number rose to 78. So while life expectancy from birth increased 28 years from 1900 to 1998, life expectancy from age 20 only increased 15 years.
In other words, if Americans in 1900 survived to adolescence, they could expect to be a card carrying member of the American Association of Retired Persons for 13 years. (Their peers in 1998 could expect 23 years as AARP members — Americans are eligible to join the AARP at age 50.)
Life expectancy statistics as we commonly see them, then, are strongly shaped by infant mortality rates. In 1900, 150 infants per 1,000 live births did not live past their first year. Infant mortality skewed life expectancy away from how long someone could expect to live if she survived her childhood.

Infant Mortality Rates in the US from 1900 to 2000. Source: Fast Track Teaching
Access to basic medical care around the world has dramatically driven down infant mortality rates over the past 50 years. By 2000, the infant mortality rate in the United States had decreased to 7 deaths per 1,000 live births.
Many factors play into life expectancy. The frequency of natural disasters, access to food, rates of violent crime, and disease prevention all affect whether an individual lives to old age or not. However, we don’t outlive our ancestors as much as we think.
To get occasional notifications when we write blog posts, sign up for our email list.